
Pharmaceutical Analysis — Pharm D Year 3
Notes for Pharmaceutical Analysis, Pharm D Year 3, organised unit by unit following the PCI Pharm D syllabus. 4 units, 20 diagrams.
Syllabus: Pharm D Year 3 syllabus
Practicals: Pharmaceutical Analysis practicals
Units in this subject
Unit 1: Quality Assurance
Expanded analytical detail
Extended practical interpretation
The laboratory should define who may approve methods, review data, release reports and investigate deviations. Training is demonstrated through observed competence, not attendance alone. Reference standards have identity, purity, storage and expiry controls. Reagents require labels, preparation records, standardization where necessary and traceability. The final report should state sample, method, result, units, specification, analyst, reviewer, date and any qualification or limitation. This makes a result useful to manufacturing, clinical, regulatory and quality decisions. Study tip: distinguish specification, acceptance criterion, control limit, calibration range and validated range. FAQ: can a retest erase an out-of-specification result? No. The investigation must establish a scientifically justified reason before invalidation. Quality reports should also record uncertainty, relevant deviations, system suitability and reviewer comments. A trend can be actionable before a specification failure occurs. A practical answer links quality to patient safety: a biased assay can release subpotent medicine, a poor impurity method can miss a harmful degradant, and weak documentation can prevent an effective recall.
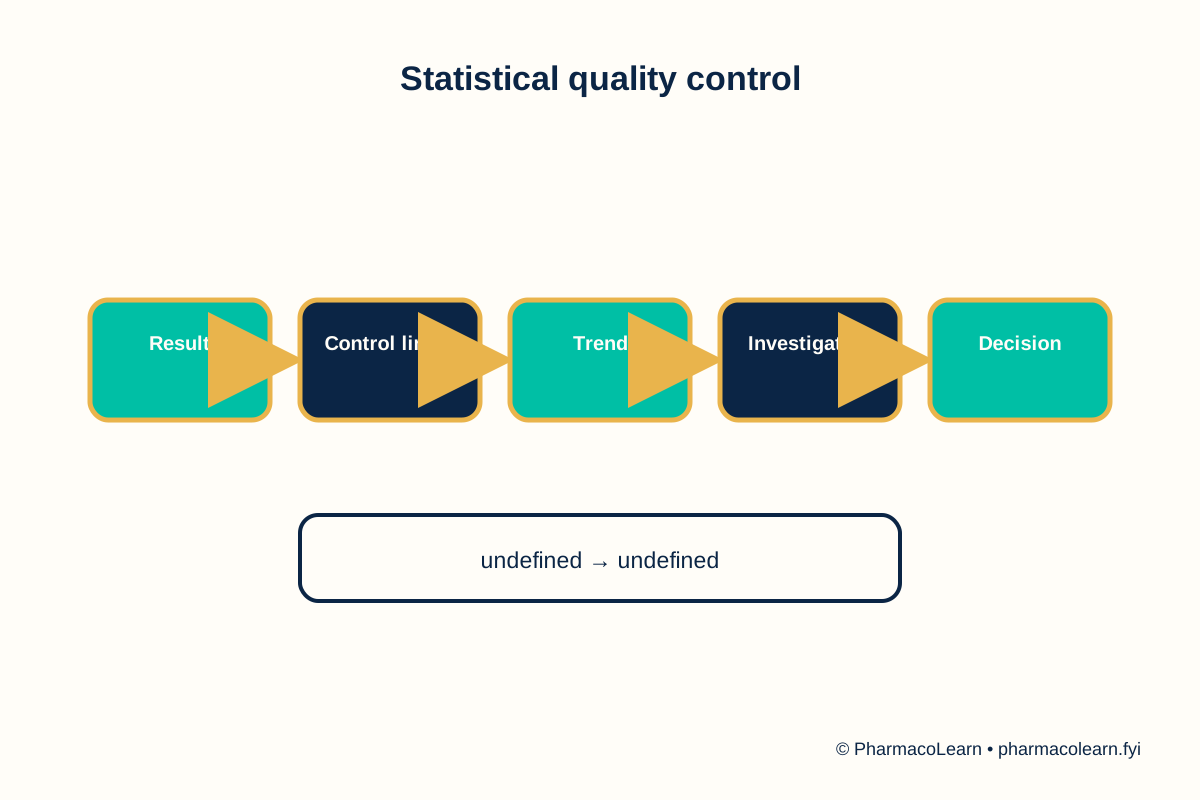
+A control chart is interpreted over time, not from one point alone. A stable process can still be biased, while a process with increasing spread can be losing precision before it fails a limit. Trend, shift, run and outlier rules must be predefined and scientifically justified. Reference materials, blanks, duplicates and spikes answer different questions: baseline contamination, response stability, repeatability and recovery. Use each control for its intended purpose.
Equipment qualification progresses from intended-use requirements through installation, operation and performance evidence. Calibration compares an instrument response with a traceable reference, while qualification demonstrates fitness of the complete system. Computerized systems need user access, audit trail, backup, data review and validated calculations. Analysts should never overwrite raw data to make a result look acceptable.
When a deviation occurs, protect the sample and records, assess impact, identify root cause, define corrective action and verify effectiveness. Quality review also examines recurring trends, complaints, stability results and supplier performance. Regulatory compliance is a continuing state, not a final certificate.
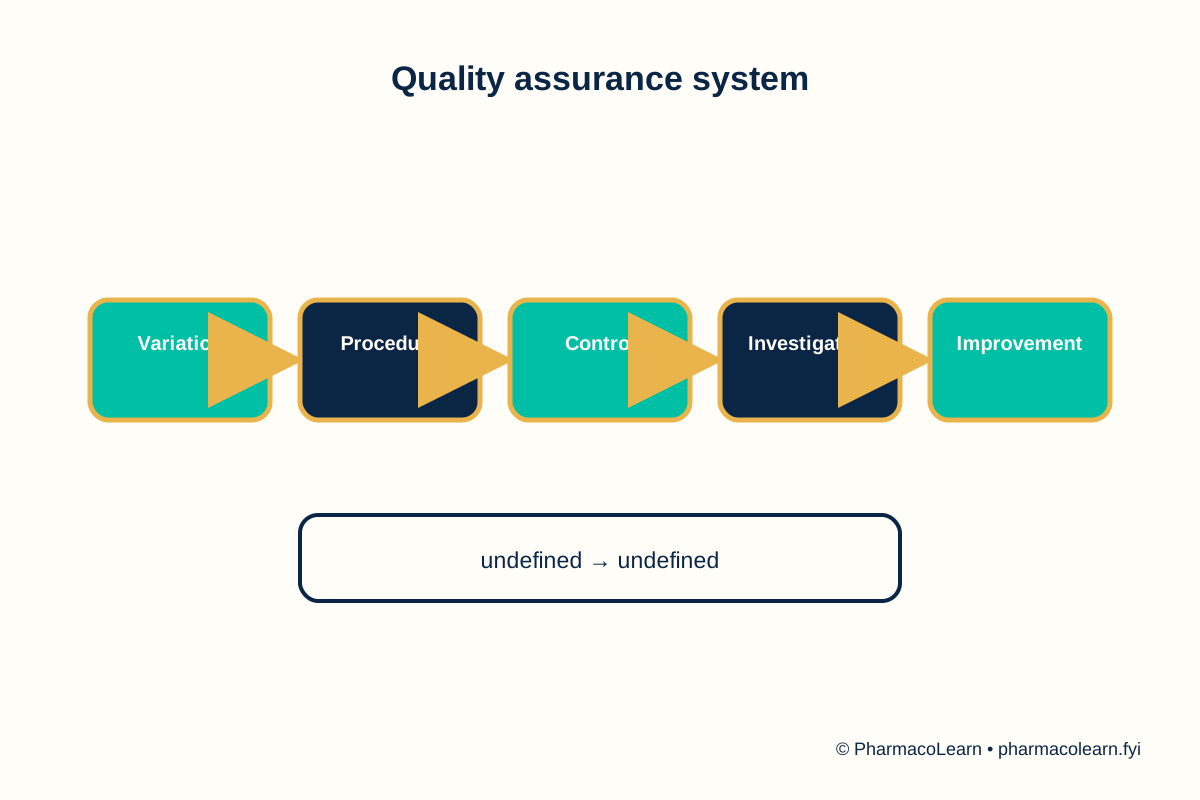
+Quality variation is controlled by identifying critical sources, measuring their effect and maintaining a process within defined limits. Sampling is often the largest hidden source of error because a small sample must represent a large batch. The analyst checks sample identity, container, storage, homogeneity and chain of custody before analysis. A method can be precise but biased, accurate on a standard but unsuitable in a complex matrix, or linear over a narrow range but unreliable at the specification limit.
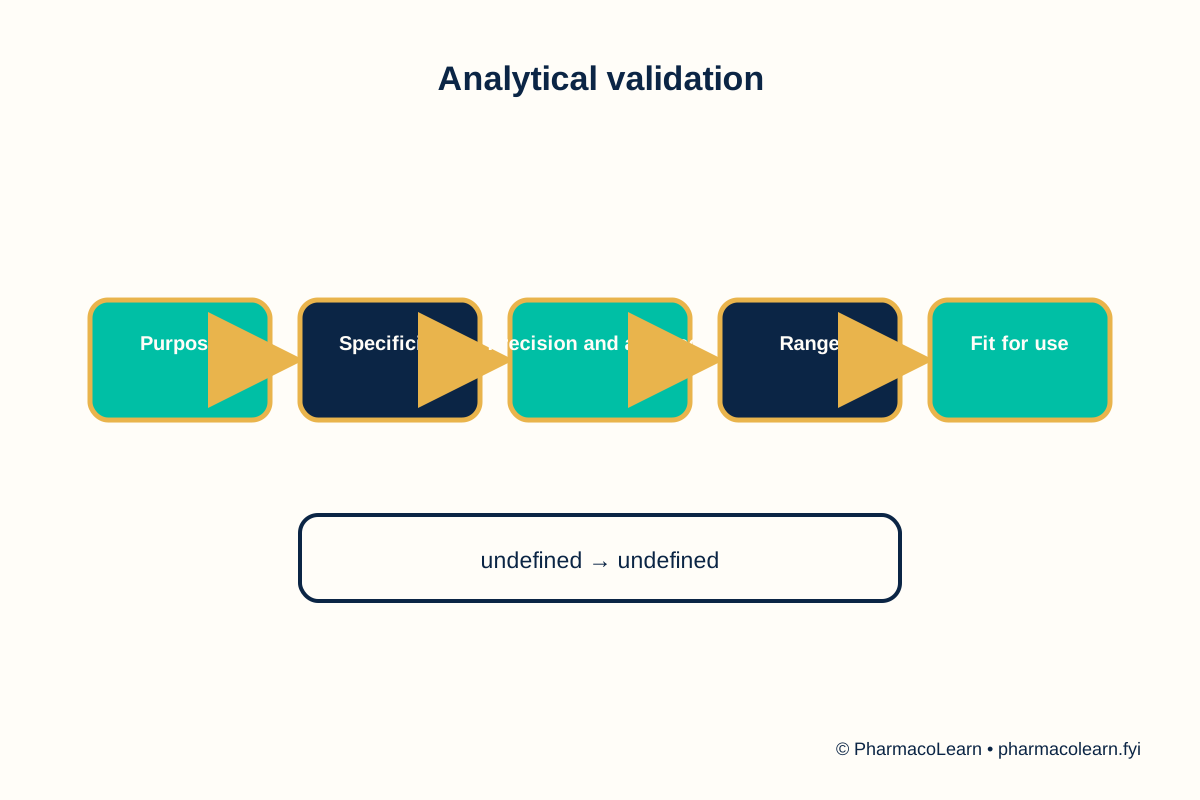
Validation is question dependent. Specificity asks whether the analyte can be measured in the presence of excipients, impurities and degradation products. Accuracy evaluates closeness to an accepted value. Precision is described through repeatability and intermediate precision. Linearity and range define the concentration interval where response is appropriate. Detection and quantitation limits matter for impurities but may be irrelevant to a high-level assay. Robustness tests the effect of deliberate small changes in method conditions.
Data integrity requires attributable, legible, contemporaneous, original or true-copy, accurate, complete and consistent records. Audit trails, controlled worksheets, electronic access, instrument clocks and calculation formulas must be managed. Out-of-specification investigations distinguish laboratory error, sampling error, manufacturing cause and true product failure. Retesting is justified only by a documented scientific procedure.
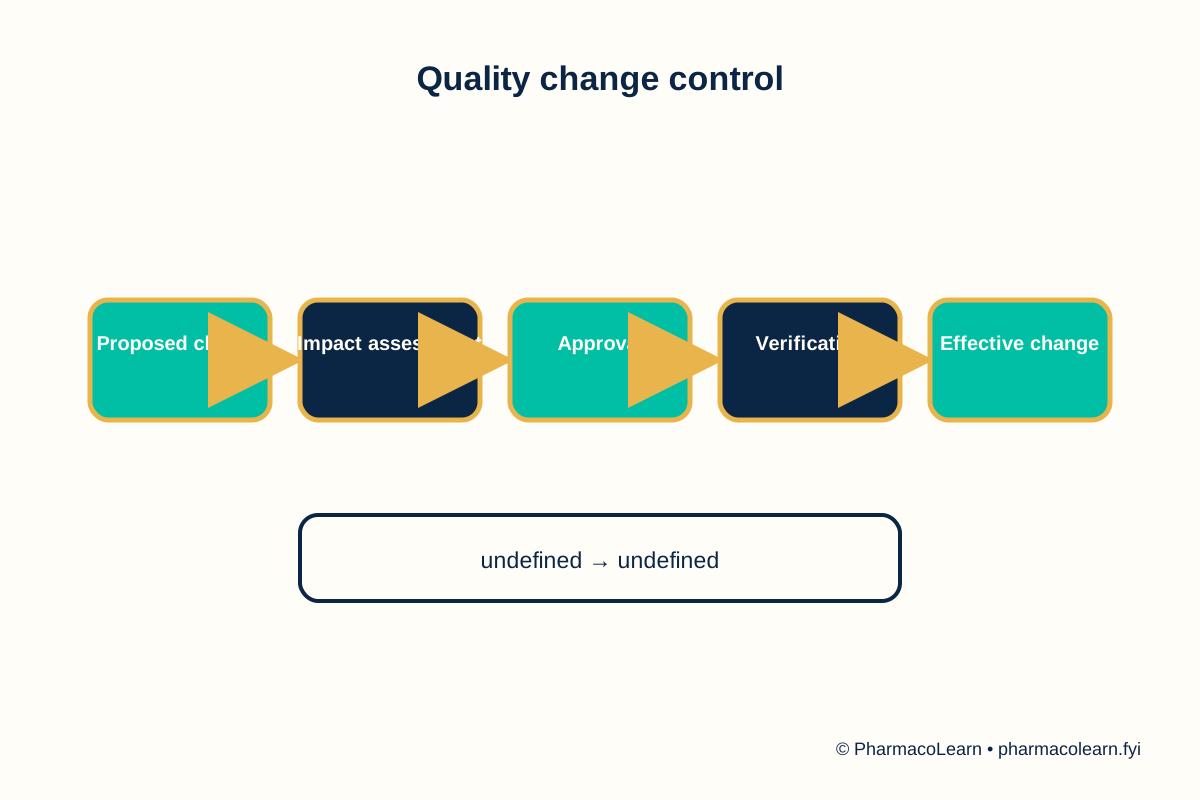
A quality system also includes change control. New equipment, software, supplier, method, packaging or facility can alter a validated state. The change is assessed, approved, implemented, verified and documented. Corrective and preventive action addresses root cause rather than merely repeating the test.
Syllabus scope
This unit covers quality variation, statistical quality control, validation, equipment, calibration, GLP, ISO 9000, TQM, documentation, ICH and regulatory control.
Core theory
Quality assurance is the planned system that gives confidence that a pharmaceutical product or analytical result is fit for its intended use. Quality control measures specific samples, while quality assurance includes organization, procedures, training, documentation, change control, deviation investigation, corrective and preventive action, supplier oversight and continual improvement. Sources of variation include raw materials, sampling, equipment, method, environment, analyst and data handling.
Statistical quality control uses control charts, repeatability, reproducibility, accuracy, precision, bias, range and trend analysis. A result outside an established control limit requires investigation, not automatic retesting until a preferred result appears. Validation demonstrates that a method is suitable for its purpose. Parameters may include specificity, selectivity, linearity, range, accuracy, precision, detection limit, quantitation limit, robustness and system suitability, according to the method and current guidance.
Equipment qualification and calibration establish that an instrument is installed, operates and performs as intended. GLP emphasizes planned work, competent personnel, traceable records, controlled procedures and reliable data. ISO 9000 principles support process control, customer focus, leadership, documented systems and improvement. Total quality management extends responsibility for quality across the organization.
ICH guidance harmonizes expectations for quality, safety and efficacy, but the applicable regulator and current version govern a submission. Regulatory control includes approved specifications, change management, laboratory investigations, data integrity and traceability. Pharmacists must understand that a passing number without a valid method, sample or record is not reliable evidence.
Analytical workflow
- Define the analyte, matrix and intended analytical question.
- Select a method whose selectivity, sensitivity and range fit the purpose.
- Prepare representative standards, blanks, controls and samples.
- Verify instrument performance and system suitability.
- Acquire data with controlled conditions and traceable settings.
- Interpret the result with uncertainty, limitations and documentation.
Pharmacist and quality correlation
Analytical results support identity, assay, purity, stability, dissolution, impurity control and release decisions. A result is meaningful only when sampling, method, calibration, equipment, calculations and data integrity are controlled. Exact acceptance criteria and validation requirements must be checked against the current pharmacopoeia, ICH guidance and applicable regulator.
Tips, FAQs and takeaways
- Why is method selection important? No method is universally best; performance must match the analytical purpose.
- Why are standards and blanks needed? They separate analyte response from background, drift and contamination.
- What is the main takeaway? Treat every result as evidence produced by a controlled measurement system.
References: PharmacoLearn Year 3 syllabus; Pharmacy Council of India, Pharm.D. Regulations 2008; USP general analytical chapters; Skoog et al., Fundamentals of Analytical Chemistry; Beckett and Stenlake, Practical Pharmaceutical Chemistry; current ICH and pharmacopoeial guidance.
Document the investigation and approval path. Review records before release. Protect data integrity. Quality is a system. Verify before release. Trace every result. Review trends. Control change. Approve scientifically. Audit completely. Always document.
Unit 2: Chromatography
Expanded analytical detail
Extended practical interpretation
A method-development decision can be recorded as a sequence: target separation, expected polarity or charge, sample matrix, stationary phase, mobile phase, detector, run time, resolution and robustness. A chromatographic impurity result should not be accepted when the peak is outside the validated range, the system suitability fails or the sample preparation is unverified. Integration is part of the method and requires review of the raw trace. Study tip: distinguish retention time, Rf, resolution, peak area, peak height, theoretical plates and tailing. FAQ: does a similar retention time prove identity? No. Matrix, co-elution and method specificity must be considered. Chromatography is a separation method, not an identity guarantee. Use standards, controls and orthogonal evidence whenever specificity is limited or the sample is complex. A practical answer links separation to decisions: identity, purity, assay, degradation, stability and batch comparison each need suitable selectivity and validation.
+A chromatographic method begins with the question: identity, assay, impurity profile, degradation monitoring or separation for collection. Choose the phase and detector accordingly. Sample preparation may involve extraction, filtration, dilution, derivatization or concentration, and each step can introduce bias or loss. Recovery must be assessed when preparation is not simple.
System suitability should evaluate the features that matter for the method, such as retention repeatability, resolution, peak symmetry, theoretical efficiency, signal-to-noise and injection precision. The criteria are method specific. When a peak is unexpected, review blank, standard, sample preparation, carryover, integration, column history and possible degradation before assigning identity.
HPLC and GC data systems can change integration, smoothing, baseline and reporting. Processing parameters must be controlled and reviewable. TLC images require controlled visualization and documentation. Electrophoresis and affinity methods also depend on buffer, temperature, sample load and separation time. Orthogonal confirmation is especially important for impurities and unknown peaks.
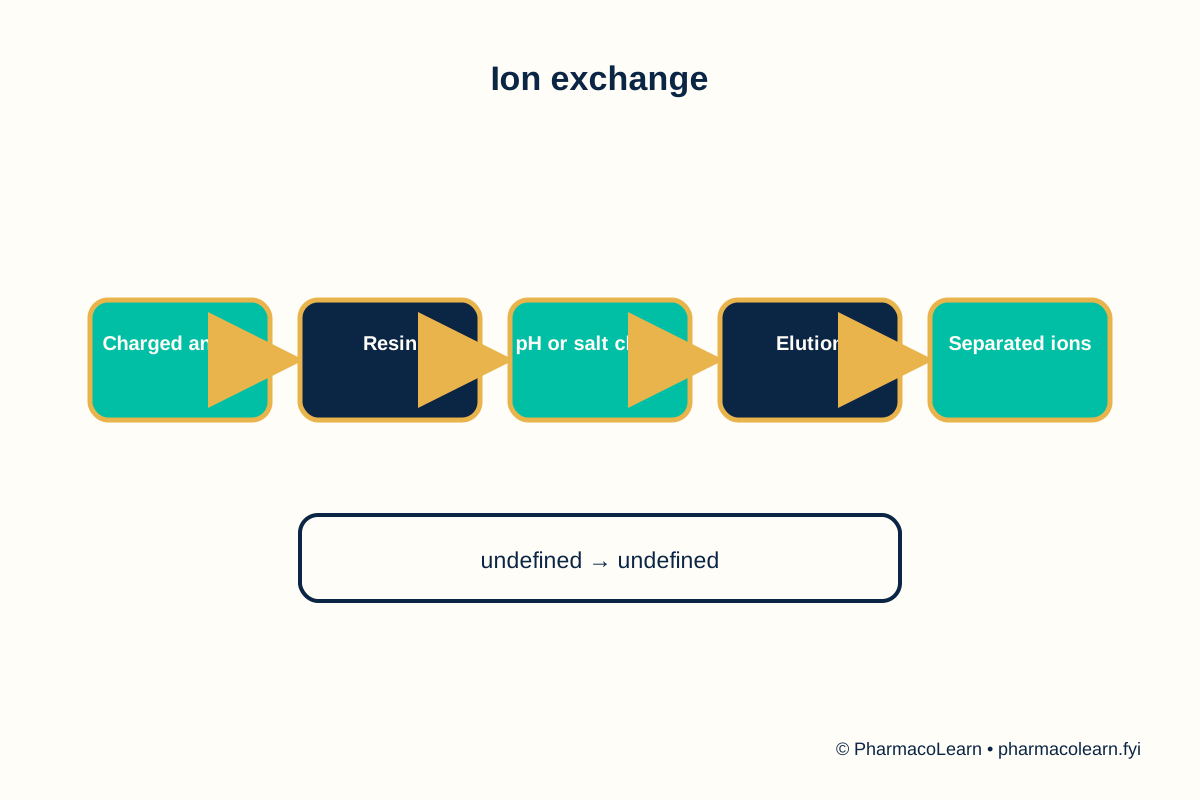
+Chromatographic selectivity results from chemical interaction, not simply distance traveled. In adsorption, solute and solvent compete for active sites. In partition, the analyte distributes between phases. In ion exchange, pH and ionic strength alter charge and retention. In size exclusion, large molecules elute earlier because they cannot enter as many pores. In affinity chromatography, a specific reversible interaction creates high selectivity.
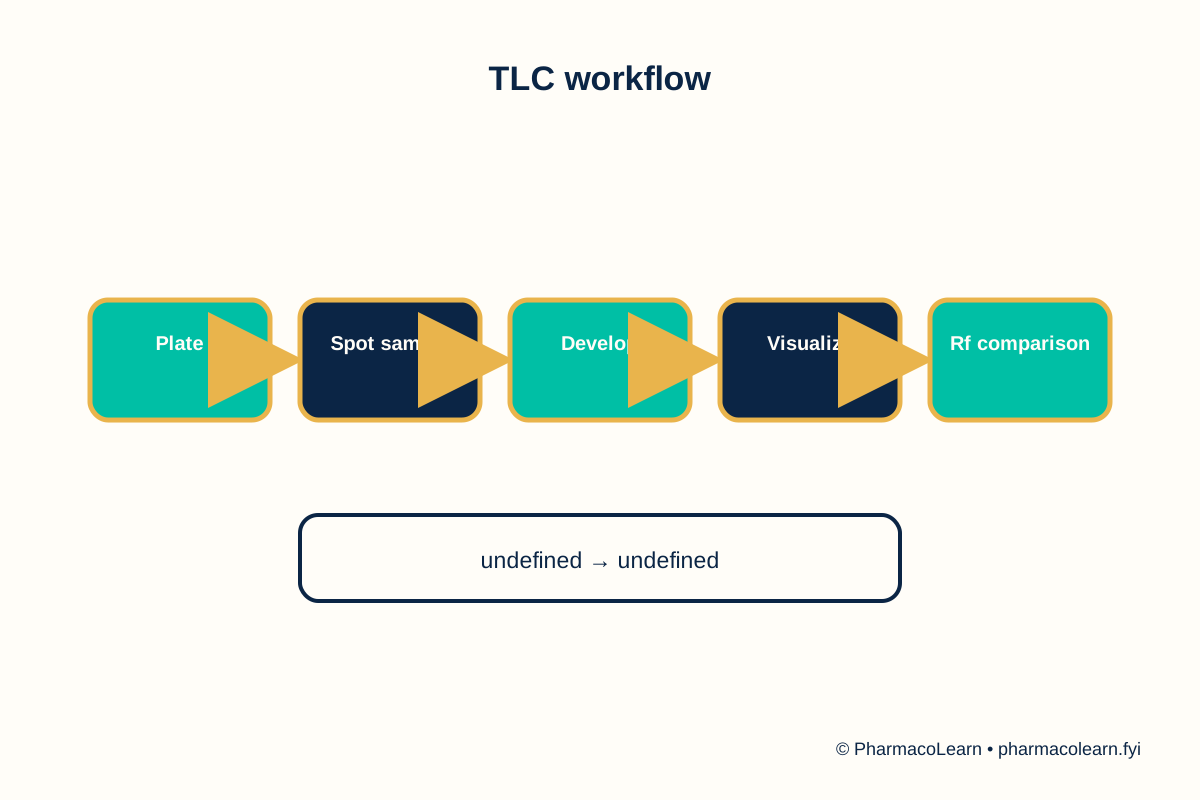
TLC is useful for identity, reaction monitoring and impurity comparison, but plate activation, sample size, solvent saturation, development distance, visualization and Rf reproducibility matter. HPLC method development considers stationary phase, mobile phase, pH, buffer, organic modifier, flow, temperature, injection volume and detector. Resolution depends on efficiency, selectivity and retention. Peak tailing may indicate adsorption, overload, active sites or poor system condition.
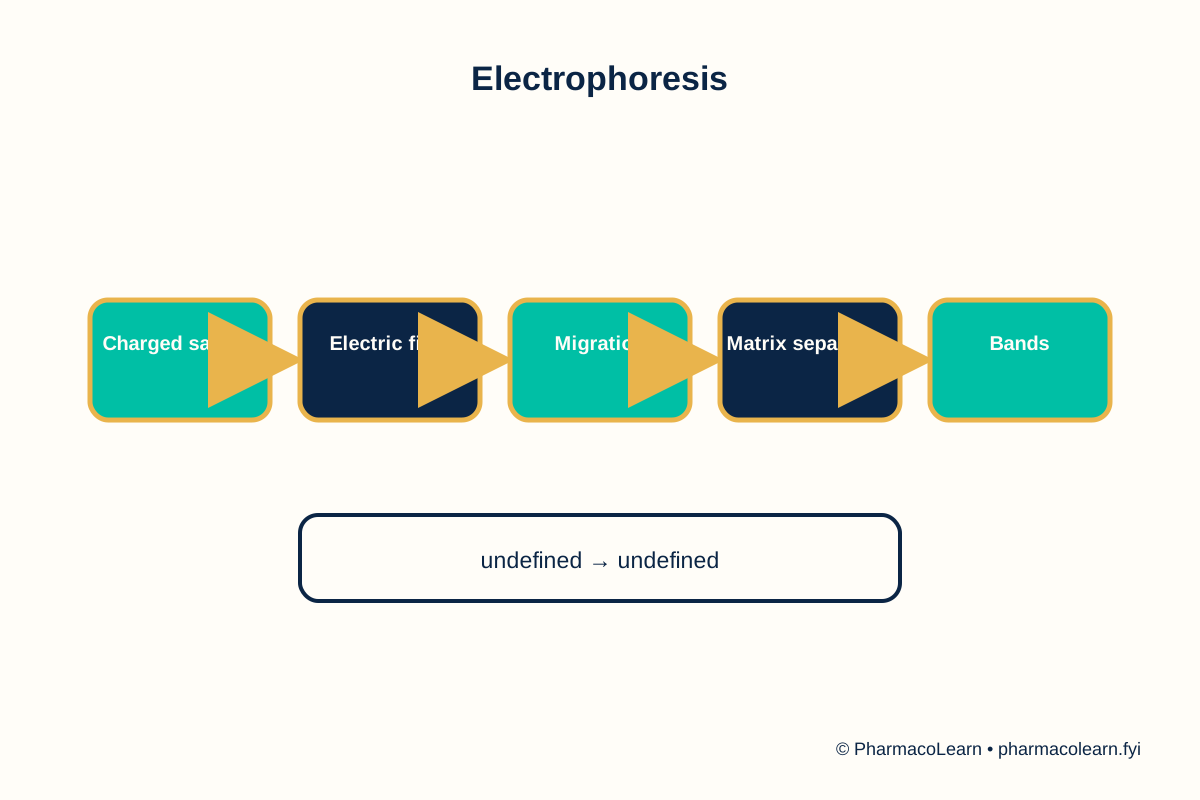
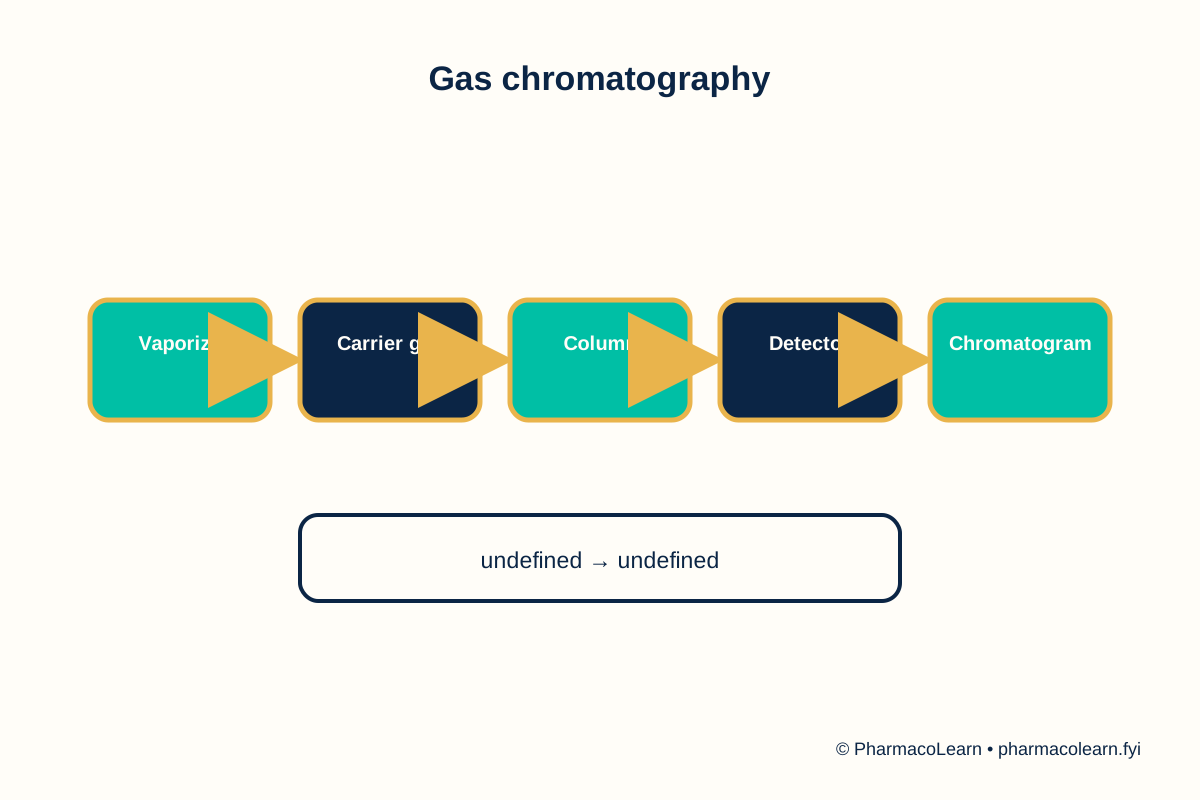
GC requires analytes to be volatile and thermally stable or to be converted into suitable derivatives. Carrier gas purity, inlet temperature, column phase, oven program and detector response affect the chromatogram. Electrophoresis depends on charge, size, shape, buffer, pH, gel and electric field. In gel filtration, the calibration range must fit the molecular size. Affinity methods require ligand specificity and controlled elution.
Quantitation requires calibration or a validated response factor. Internal standards compensate for some injection and preparation variation. A reference standard confirms identity or response, but a matching retention time does not prove structural identity when co-elution is possible. Orthogonal methods strengthen conclusions.
Syllabus scope
This unit covers column chromatography, TLC, paper chromatography, ion exchange, HPLC, HPTLC, gas chromatography, electrophoresis, gel filtration and affinity chromatography.
Core theory
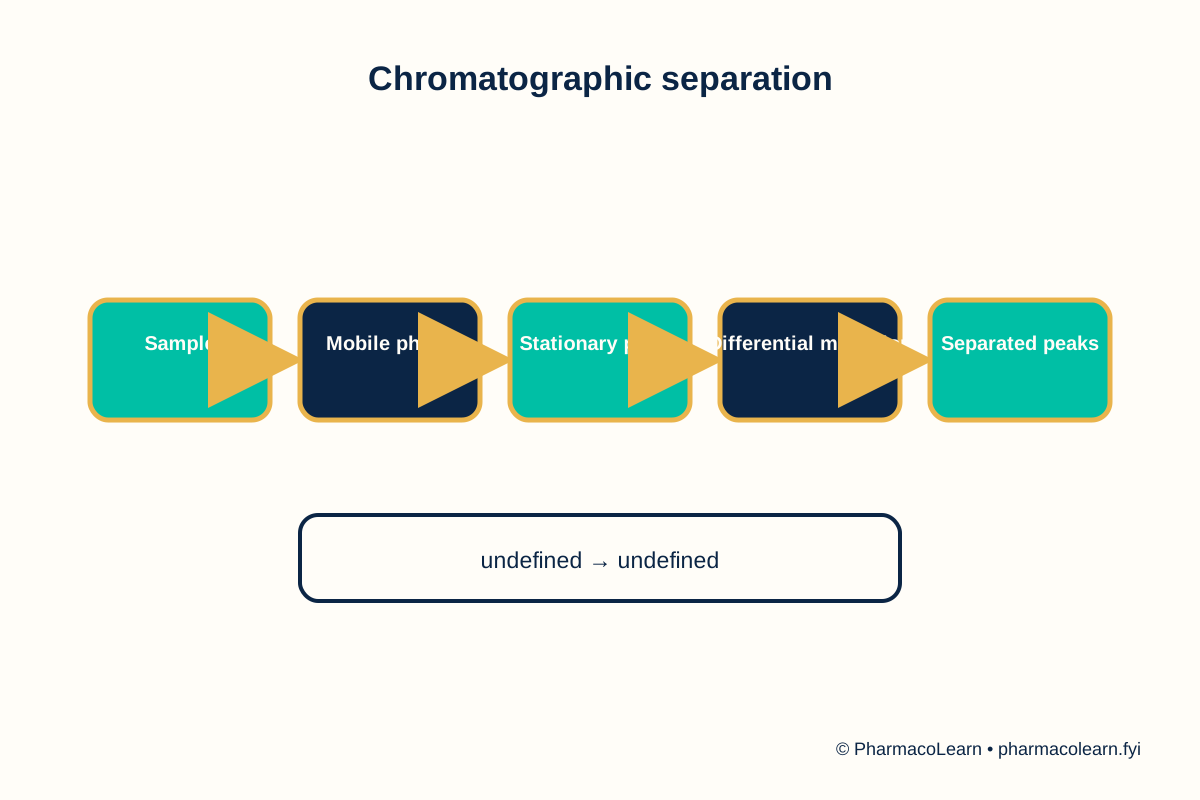
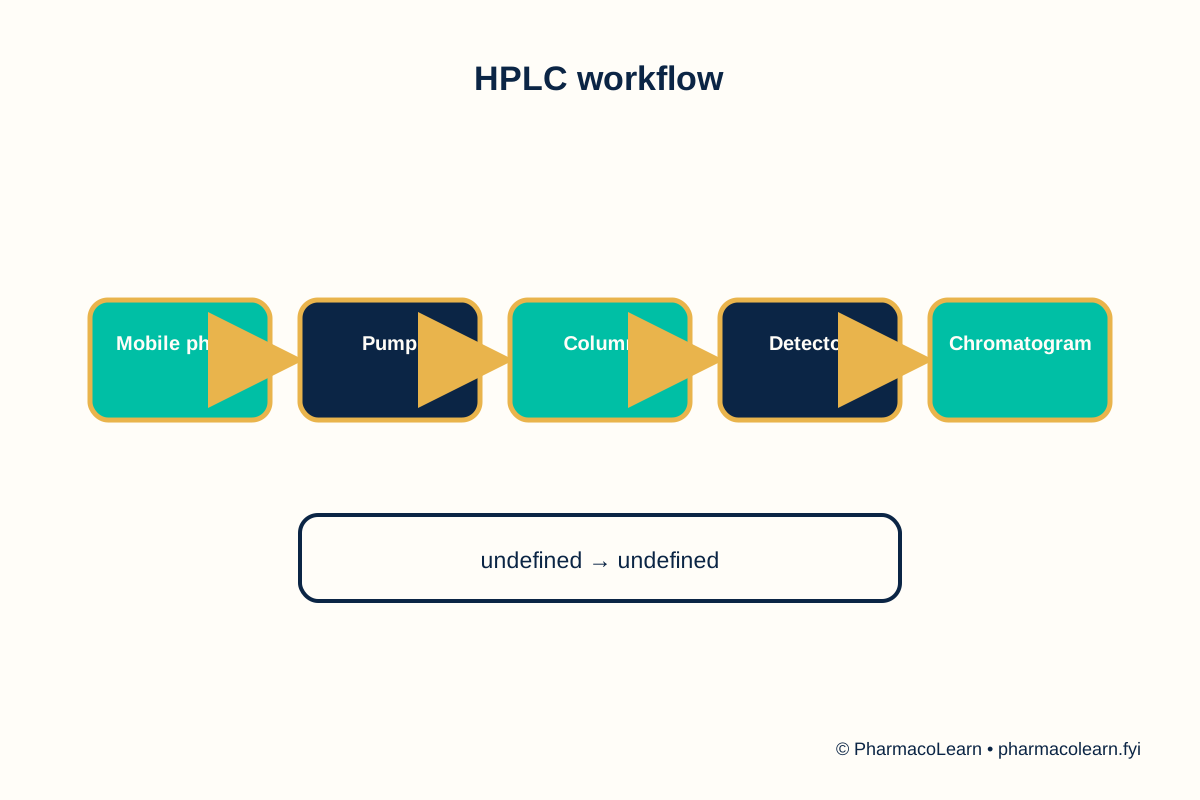
Chromatography separates components because they distribute differently between a stationary phase and a mobile phase. Separation depends on adsorption, partition, ion exchange, size exclusion or specific affinity. The workflow is prepare representative sample, select stationary and mobile phases, introduce the sample, allow differential migration, detect separated zones and interpret with standards and system suitability.
Column chromatography uses a packed stationary phase and elution. Efficiency depends on particle size, packing, flow, solvent strength, band broadening and sample loading. TLC uses a coated plate and produces an Rf value defined by analyte distance relative to solvent-front distance under specified conditions. Paper chromatography uses partition or related interactions in paper fibers and mobile solvent. Ion-exchange chromatography uses charged resins and is controlled by pH, ionic strength and competing ions.
HPLC uses a pump, injector, column, mobile phase, detector and data system. Retention time supports identity, while peak area or height supports quantitation after calibration. HPTLC improves plate handling and densitometric measurement. Gas chromatography uses a vaporized sample, carrier gas, column and detector, often after derivatization when volatility or thermal stability is inadequate. Electrophoresis separates charged species by movement in an electric field. Gel filtration separates by hydrodynamic size. Affinity chromatography uses selective ligand binding.
Pharmaceutical analysis requires control of resolution, retention, peak shape, baseline, carryover, injection precision and detector response. A chromatogram is not interpreted by retention time alone when co-elution or matrix interference is possible.
Analytical workflow
- Define the analyte, matrix and intended analytical question.
- Select a method whose selectivity, sensitivity and range fit the purpose.
- Prepare representative standards, blanks, controls and samples.
- Verify instrument performance and system suitability.
- Acquire data with controlled conditions and traceable settings.
- Interpret the result with uncertainty, limitations and documentation.
Pharmacist and quality correlation
Analytical results support identity, assay, purity, stability, dissolution, impurity control and release decisions. A result is meaningful only when sampling, method, calibration, equipment, calculations and data integrity are controlled. Exact acceptance criteria and validation requirements must be checked against the current pharmacopoeia, ICH guidance and applicable regulator.
Tips, FAQs and takeaways
- Why is method selection important? No method is universally best; performance must match the analytical purpose.
- Why are standards and blanks needed? They separate analyte response from background, drift and contamination.
- What is the main takeaway? Treat every result as evidence produced by a controlled measurement system.
References: PharmacoLearn Year 3 syllabus; Pharmacy Council of India, Pharm.D. Regulations 2008; USP general analytical chapters; Skoog et al., Fundamentals of Analytical Chemistry; Beckett and Stenlake, Practical Pharmaceutical Chemistry; current ICH and pharmacopoeial guidance.
Document the chromatogram and integration review. Review system suitability before reporting. Protect sample integrity. Separation is evidence. Verify before identification. Trace every peak. Review resolution. Control carryover. Integrate accurately. Resolve uncertainty. Always document.
Unit 3: Electrometric Methods
Expanded analytical detail
Extended practical interpretation
Electrometric calculations must preserve units and account for dilution, blank, cell constant, electrode response and stoichiometric ratio. Temperature should be recorded because potential, conductivity, reaction rate and viscosity may change. A failed calibration is an instrument event that must be resolved before sample results are interpreted. Do not average technically invalid readings simply to obtain a smooth value. Study tip: distinguish potential, current and conductance. FAQ: why calibrate before measurement? Because electrode slope, cell constant and reference potential directly affect the result. Electrometric methods are especially sensitive to temperature, electrode condition and matrix. Record these conditions so another analyst can reproduce the measurement. A practical answer links the electrical signal to chemistry, calibration and endpoint interpretation, then states the main source of interference and the control used.
+Electrode methods require conditioning and maintenance. A pH electrode may respond slowly after drying, contamination or coating. A reference junction can clog or develop unstable potential. Conductivity cells require a correct cell constant and temperature control. Before a titration, verify blank, standard, sample volume, stirring, addition rate and endpoint algorithm.
Electrochemical curves contain information about reaction and transport, but the signal is not automatically selective. Interfering ions, oxygen, electrode fouling, adsorption and convection can distort current. Polarographic parameters should be interpreted under the method's assumptions. Amperometric titration requires a potential where the measured species gives useful current and the matrix does not dominate.
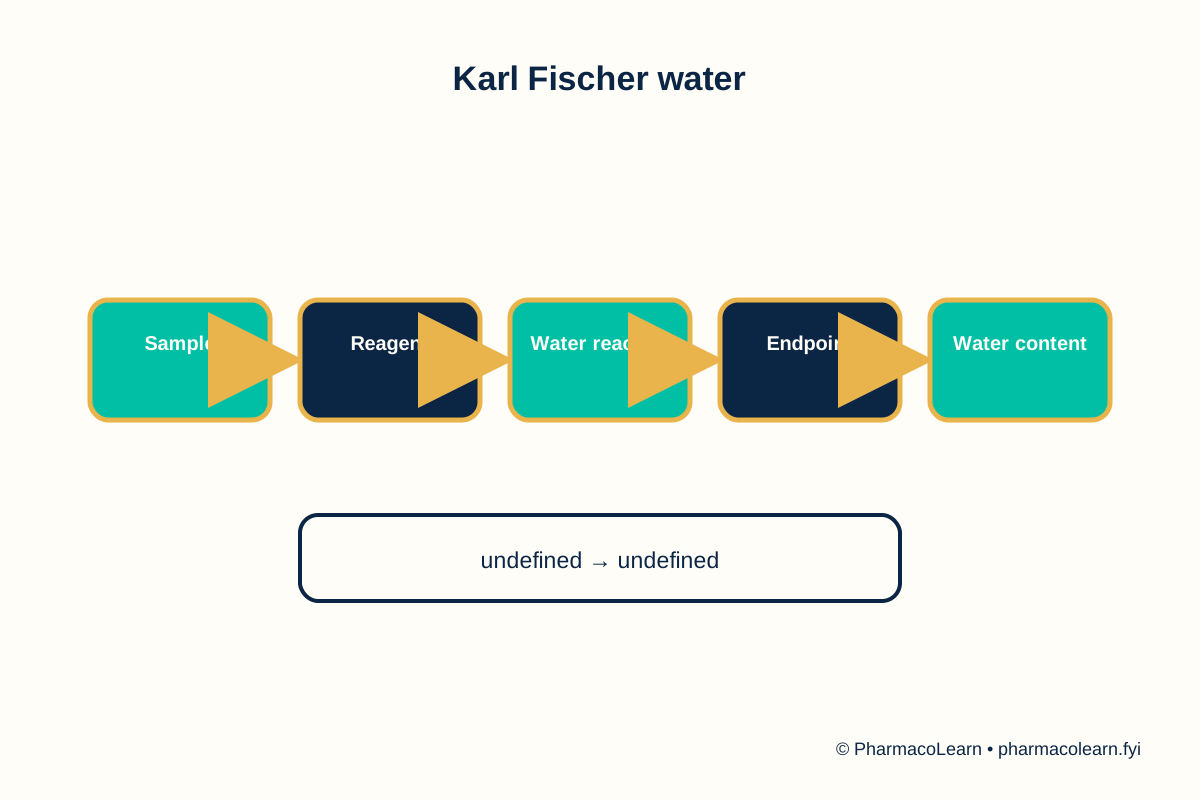
Karl Fischer methods require attention to atmospheric moisture, reagent titer, solvent compatibility and side reactions. Direct and indirect approaches may be selected based on solubility and matrix. A water result should be reported with method, sample state and relevant correction rather than treated as a universal property.
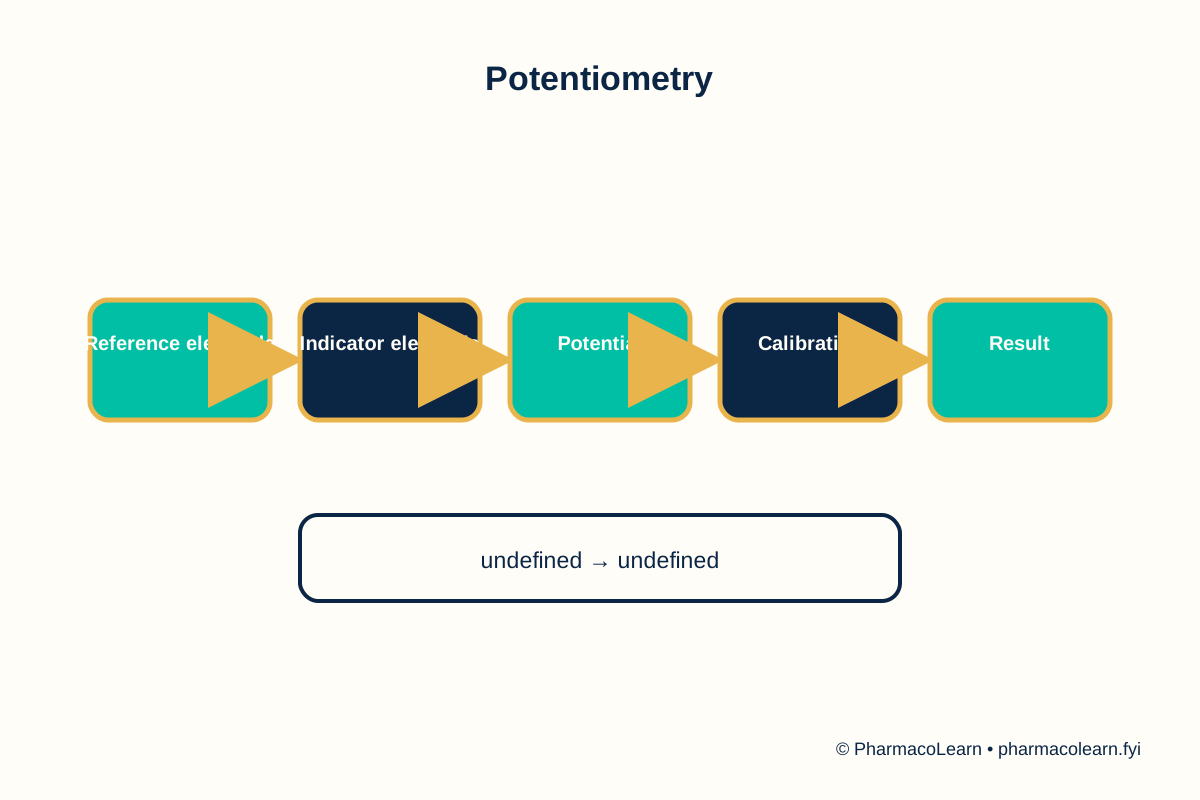
+Potential is measured as a difference between electrodes, so junction potential, reference stability, temperature, solution composition and electrode conditioning affect the result. pH electrodes require correct hydration, calibration, slope verification and cleaning. A drifting or slow electrode can create a plausible but wrong value. Potentiometric endpoints are identified from a potential-volume curve or its derivative rather than from an arbitrary color change.
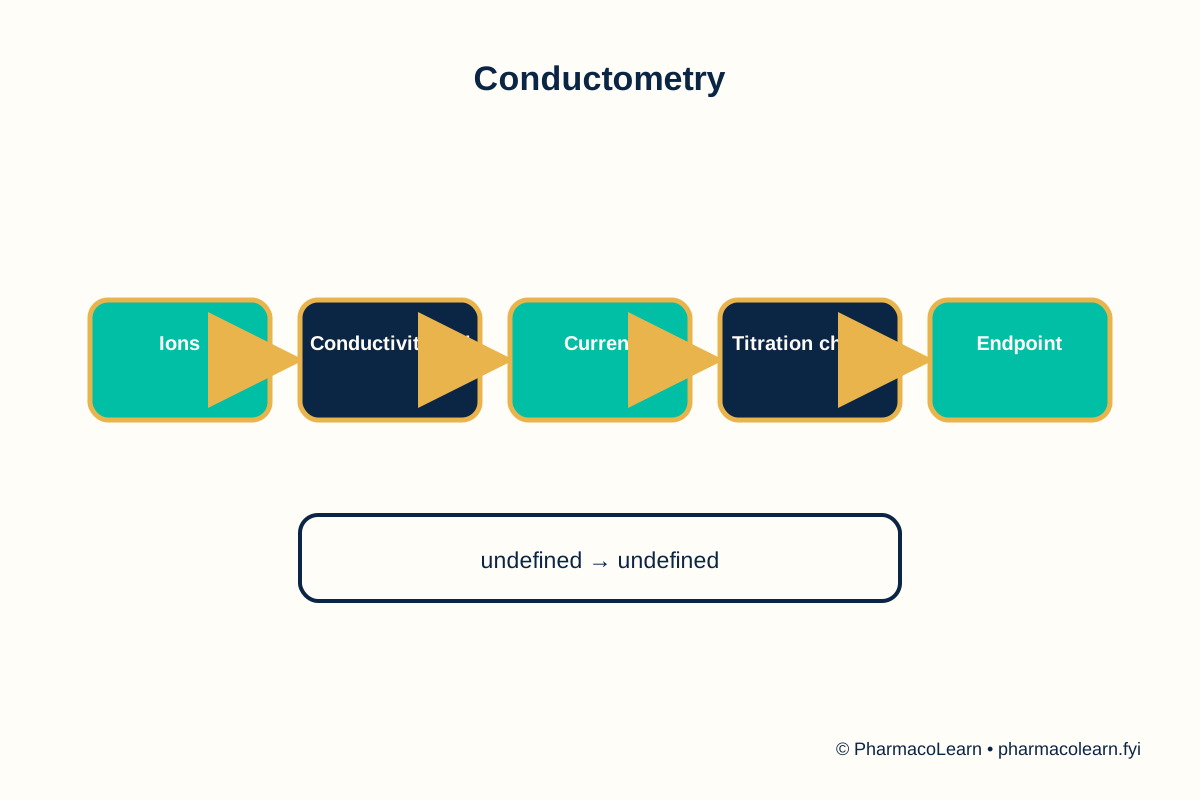
Conductivity is temperature dependent and must be measured with a suitable cell constant. Conductometric endpoints arise from replacement of ions with different mobility or from precipitation or neutralization. The method is useful in colored or turbid samples but becomes less selective when many ions contribute to the signal.
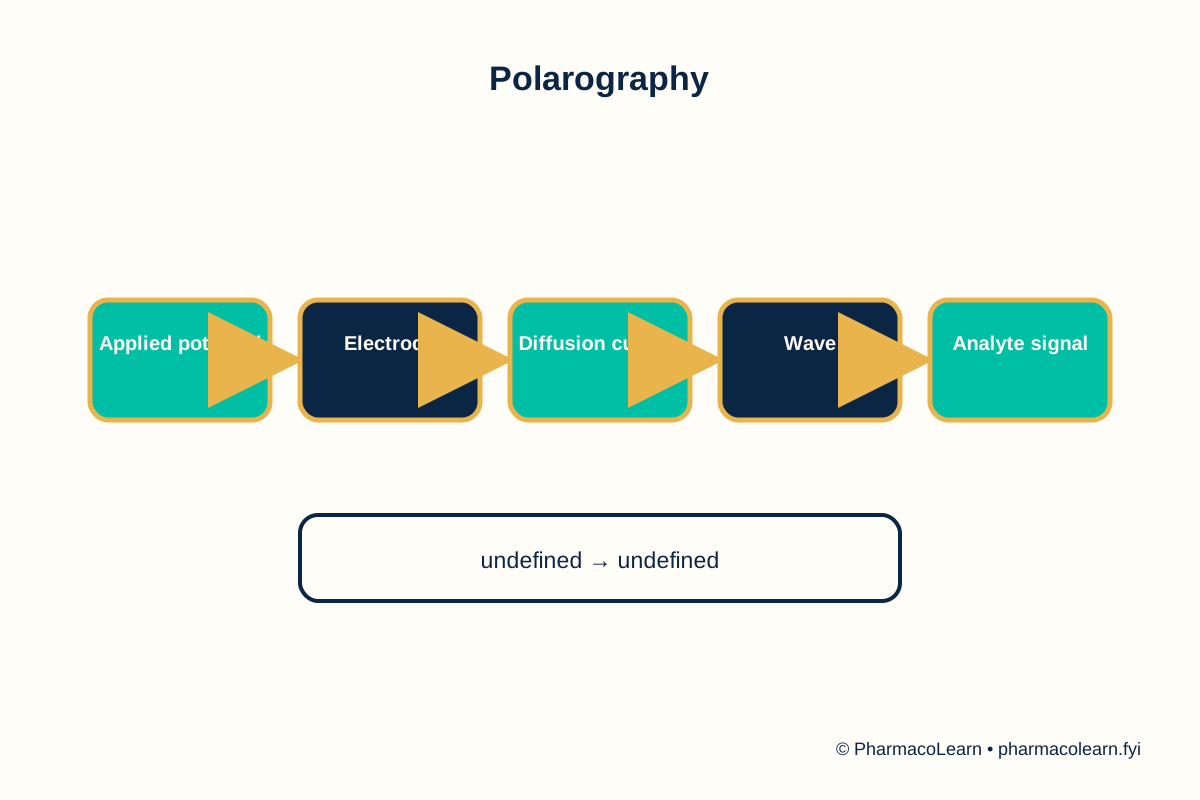
Polarography and amperometry depend on mass transport, diffusion, convection, electrode area, applied potential and electroactive interferents. Oxygen can create additional waves. The residual current is separated from diffusion current, and suppressors or deaeration may be used according to the method. The dropping mercury electrode has historical importance, while modern electrochemical methods use other electrode systems where appropriate.
Karl Fischer analysis is specific to water only when side reactions and sample solubility are controlled. A blank corrects reagent or solvent water. The pharmacist should distinguish water content, loss on drying and water activity because they measure different properties. Each electrometric method requires calibration, control, appropriate electrodes and documented temperature.
Syllabus scope
This unit covers potentiometry, conductometry, polarography and amperometric titrations.
Core theory
Electrometric methods measure electrical potential, conductance or current to obtain chemical information. Potentiometry measures potential under conditions of negligible current. A cell uses a reference electrode with stable potential and an indicator electrode responsive to the analyte or ion activity. pH electrodes respond to hydrogen-ion activity and require calibration with appropriate standards. Potentiometric titrations locate an endpoint from the change in potential as titrant is added. Karl Fischer titration measures water through a specific chemical reaction and requires control of solvent, reagent and interference.
Conductometry measures the ability of a solution to conduct electricity. It depends on ion concentration, charge, mobility, temperature and cell constant. Conductometric titrations detect changes in conductivity as ions are consumed or produced. They are useful when a visual indicator is unsuitable, but temperature and electrode condition matter.
Polarography measures current as a function of applied potential, historically using a dropping mercury electrode. Residual current, diffusion current, limiting current, oxygen, maxima and suppressors influence the wave. The Ilkovic relationship links diffusion current to analyte and electrode conditions under defined assumptions. Amperometric titrations measure current at a selected potential while titrant is added. They can be sensitive but require appropriate electrode selectivity and control of interfering electroactive substances.
The pharmacist interprets calibration, blank, temperature, electrode response, standardization, endpoint shape and sample matrix. Instrument output must be linked to a validated method and traceable calculation.
Analytical workflow
- Define the analyte, matrix and intended analytical question.
- Select a method whose selectivity, sensitivity and range fit the purpose.
- Prepare representative standards, blanks, controls and samples.
- Verify instrument performance and system suitability.
- Acquire data with controlled conditions and traceable settings.
- Interpret the result with uncertainty, limitations and documentation.
Pharmacist and quality correlation
Analytical results support identity, assay, purity, stability, dissolution, impurity control and release decisions. A result is meaningful only when sampling, method, calibration, equipment, calculations and data integrity are controlled. Exact acceptance criteria and validation requirements must be checked against the current pharmacopoeia, ICH guidance and applicable regulator.
Tips, FAQs and takeaways
- Why is method selection important? No method is universally best; performance must match the analytical purpose.
- Why are standards and blanks needed? They separate analyte response from background, drift and contamination.
- What is the main takeaway? Treat every result as evidence produced by a controlled measurement system.
References: PharmacoLearn Year 3 syllabus; Pharmacy Council of India, Pharm.D. Regulations 2008; USP general analytical chapters; Skoog et al., Fundamentals of Analytical Chemistry; Beckett and Stenlake, Practical Pharmaceutical Chemistry; current ICH and pharmacopoeial guidance.
Document calibration and electrode condition. Review the blank and standard. Protect measurement integrity. Electrochemistry is measurement. Verify before calculation. Trace every reading. Review stability. Control temperature. Calibrate carefully. Validate endpoints. Always document.
Unit 4: Spectroscopy
Expanded analytical detail
Extended practical interpretation
A spectroscopy result is stronger when identity and quantity are supported by independent evidence. For example, a chromatographic peak with a spectral match can be more informative than either retention time or spectrum alone. The report should identify wavelength or frequency, path length, solvent or matrix, calibration model, instrument, raw file and processing steps. Thermal and diffraction data should be interpreted with polymorphism, solvates and sample history in mind. Study tip: distinguish absorption, emission, fluorescence, rotation, mass-to-charge and thermal transition. FAQ: why is a blank essential? It corrects background from solvent, matrix, cell and instrument. Spectroscopic data are strongest when raw data, processing parameters, calibration and sample preparation are preserved together. Interpretation must state uncertainty and limitations. A practical answer links the spectrum or thermal trace to molecular behavior, instrument conditions, calibration and the evidence supporting the final conclusion.
+Spectral preparation is often more important than the instrument brand. A blank must match the solvent and matrix. Cells need the correct path length, cleanliness and orientation. A standard curve should cover the sample response and include independent checks. For IR, sample contact and background must be controlled. For fluorescence, concentration should avoid self-absorption and quenching.
Atomic analysis requires matching standards and sample matrix as closely as possible or using a validated correction. Nebulization and flame conditions affect atom population. In mass spectrometry, ion source, analyzer, detector, adducts and fragmentation influence the spectrum. NMR requires suitable solvent, concentration, field, reference and acquisition parameters. Thermal methods require defined sample mass, pan, atmosphere and heating rate.
When a spectrum is interpreted, identify the measured transition, the calibration or reference basis, potential interferences and the level of structural certainty. A library match or single band is supportive evidence, not always proof. Retain raw spectra and processed reports together so another qualified reviewer can reproduce the conclusion.
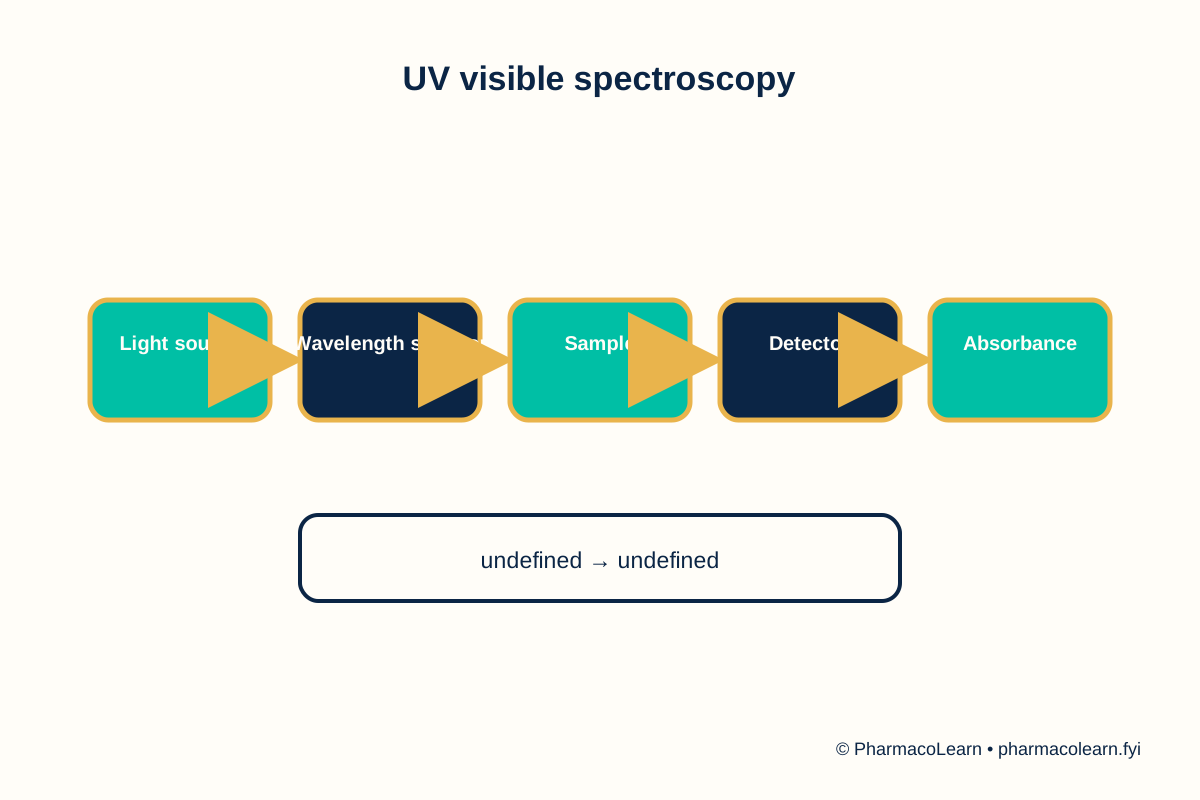
+Beer-Lambert behavior is conditional. A calibration plot should be prepared over the working range, with suitable blank and independent checks. Stray light, chemical equilibrium, solvent absorption, particulate scattering and polychromatic radiation can produce deviations. UV-visible spectra support assay, impurity monitoring, kinetic measurements and simultaneous analysis when the mathematical and selectivity requirements are met.
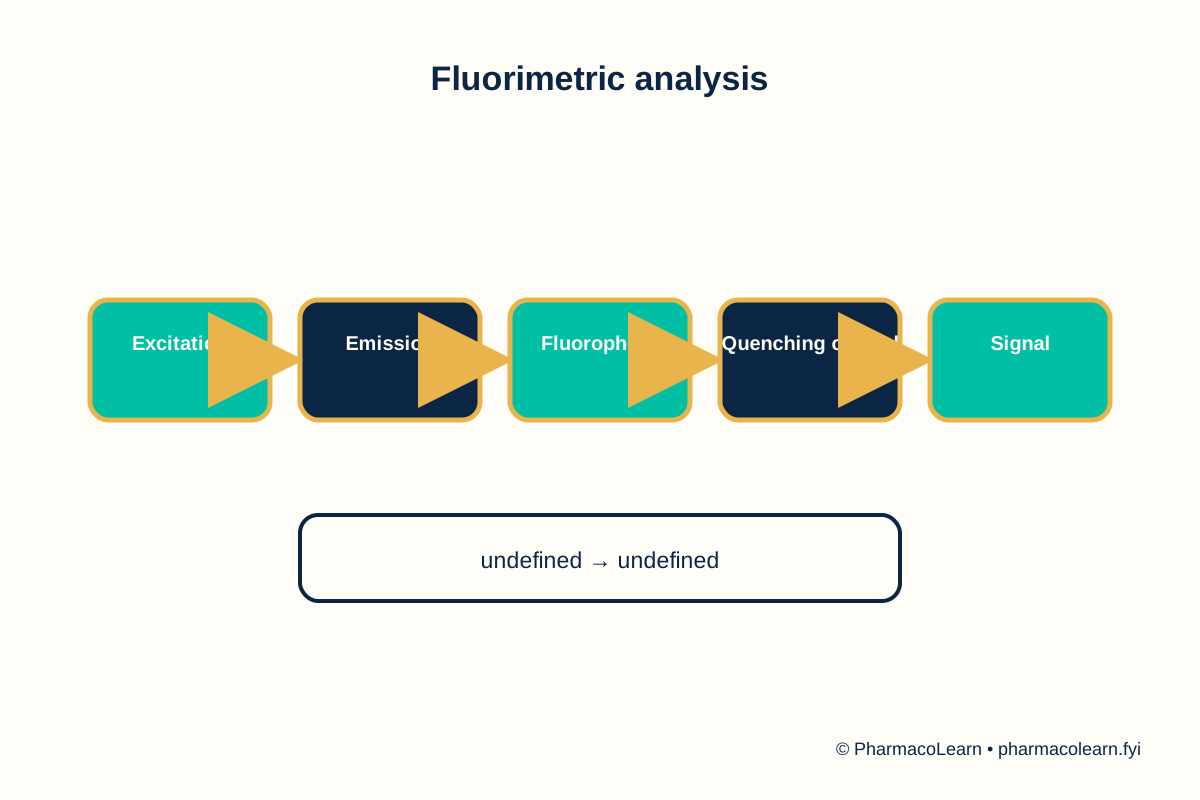
IR sample handling depends on state and matrix. Moisture, particle size, contact, path length and instrument background affect bands. Functional-group interpretation requires the whole spectrum, not one peak in isolation. Fluorescence is sensitive but can be affected by quenching, inner-filter effects, oxygen, concentration and photodegradation. It therefore needs controlled geometry and calibration.
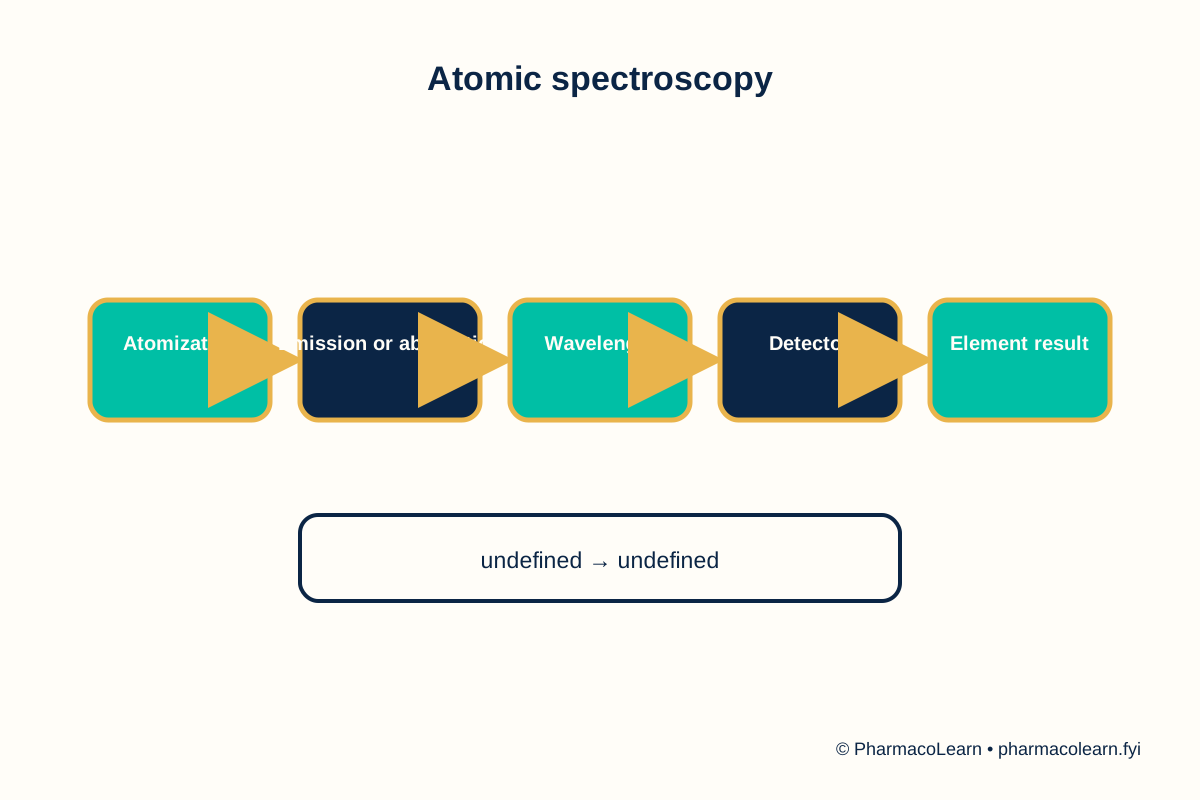
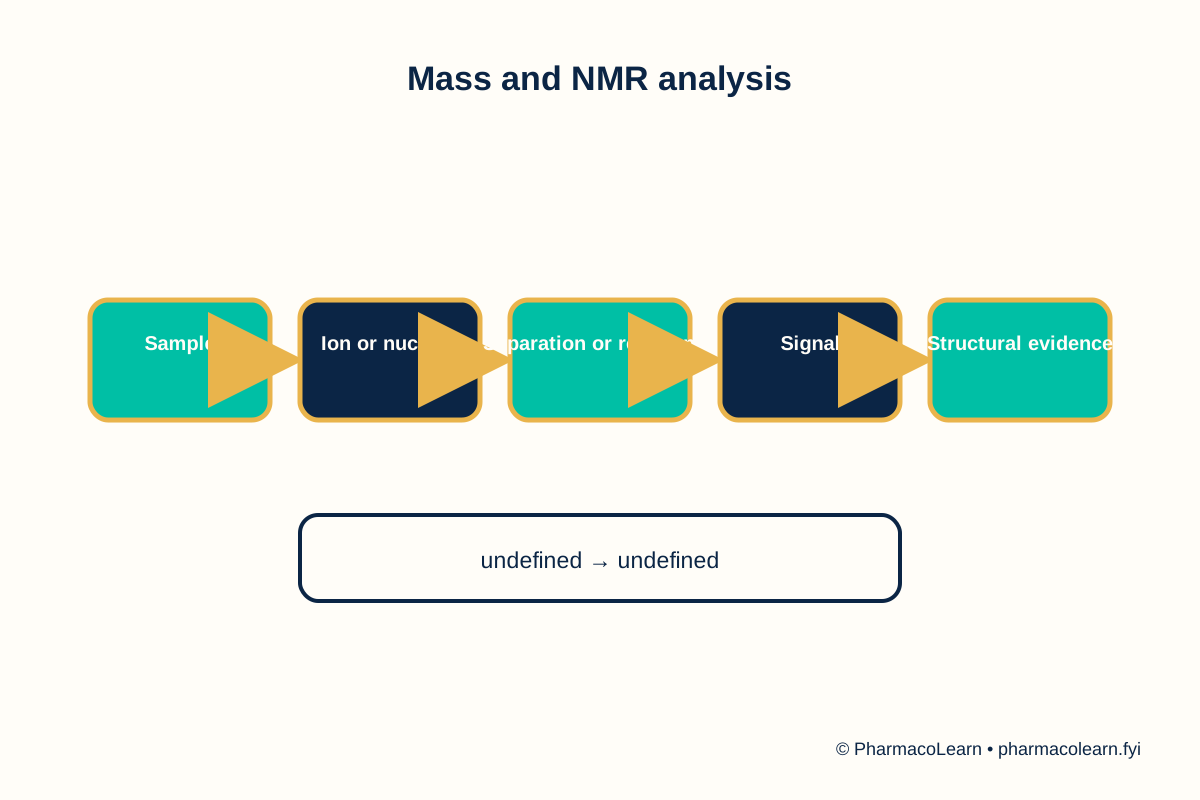
Atomic methods require atom formation. Flame conditions, nebulization, matrix viscosity, ionization, background absorption and spectral overlap influence signal. NMR interpretation considers chemical shift, integration, multiplicity and coupling, while ESR focuses on unpaired electrons. Mass spectra reflect ionization and fragmentation, so library matching requires appropriate source and instrument conditions.
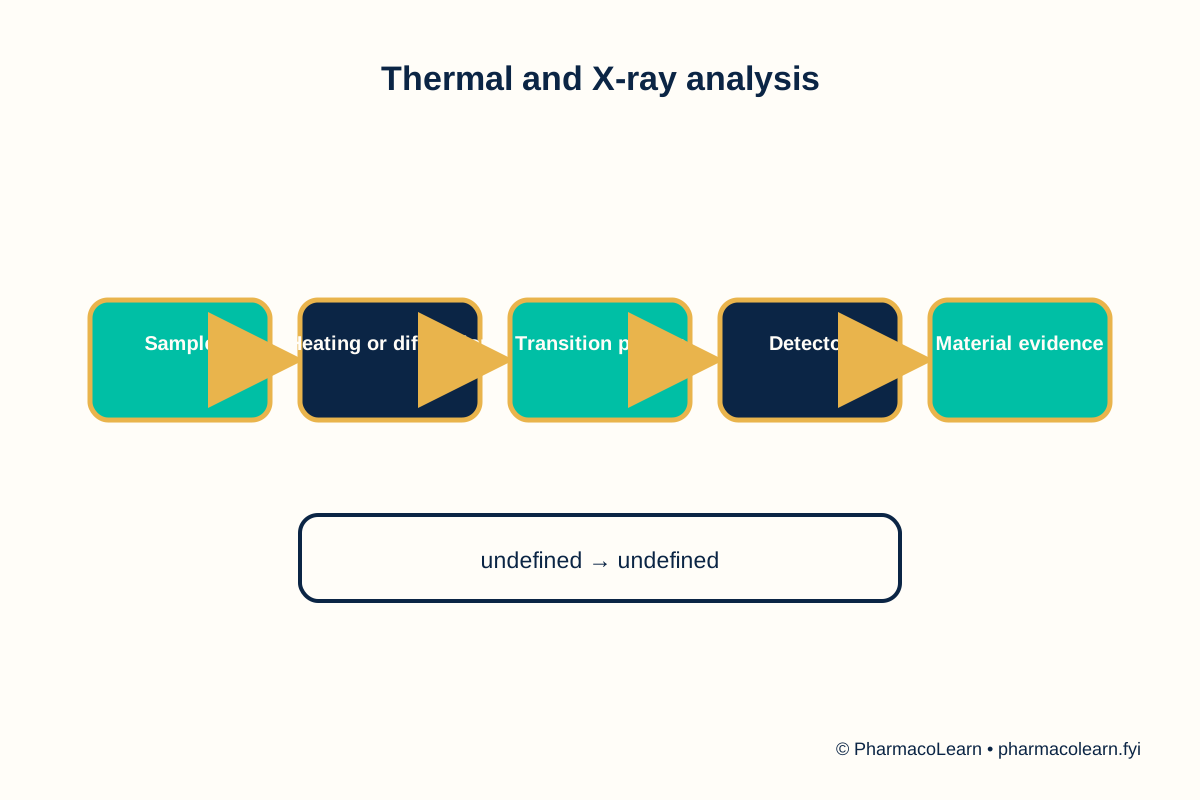
Polarimetry depends on path length, temperature, wavelength, concentration and solvent. X-ray diffraction identifies crystalline organization and can distinguish polymorphs. DSC and DTA reveal thermal events such as melting, crystallization, desolvation or decomposition, but interpretation requires controlled heating, sample mass and atmosphere.
A good analytical conclusion states the technique, sample preparation, calibration, signal, identity or quantitation basis, interference control and uncertainty. Spectral data should be stored with method version, instrument, raw file and processing record.
Syllabus scope
This unit covers absorption, UV-visible, infrared, fluorimetry, flame photometry, atomic absorption, atomic emission, NMR, ESR, mass spectrometry, polarimetry, X-ray diffraction and thermal analysis.
Core theory
Spectroscopy studies interaction between matter and electromagnetic radiation. Absorption occurs when photon energy matches an allowed transition. UV-visible methods commonly measure electronic transitions and use Beer-Lambert behavior within a validated range. Absorbance depends on path length, concentration and molar absorptivity. Deviations can arise from high concentration, chemical association, stray light, polychromatic radiation, turbidity or instrumental limits. Chromophores absorb radiation and auxochromes modify intensity or wavelength. Bathochromic, hypsochromic, hyperchromic and hypochromic changes describe spectral shifts.
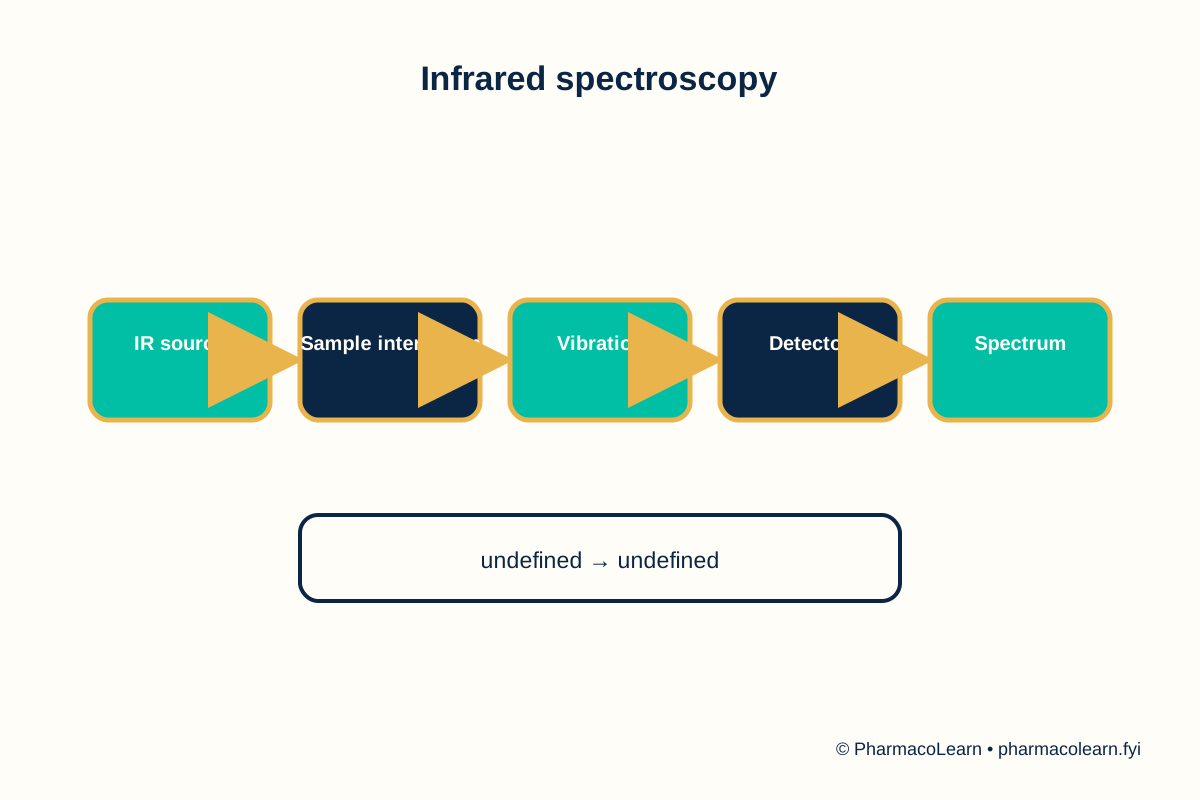
A UV-visible instrument contains a source, wavelength selector or monochromator, sample cell, detector and readout. Infrared spectroscopy measures vibrational transitions and relates absorption bands to functional groups and molecular structure. Fluorimetry measures emitted light after excitation and is sensitive to concentration, quenching, pH, solvent, temperature and instrumental geometry.
Flame photometry and atomic absorption measure atomic emission or absorption after atomization. Interference can be spectral, chemical, ionization or physical. Atomic emission uses excited atoms and measures emitted radiation. NMR provides information from nuclei in a magnetic field, while ESR detects unpaired electrons. Mass spectrometry forms ions, separates them by mass-to-charge ratio and records a spectrum influenced by fragmentation. Polarimetry measures optical rotation. X-ray diffraction reveals crystalline arrangement through diffraction patterns. Thermal analysis measures mass, heat flow or transitions as temperature changes, including DSC and DTA.
Analytical interpretation requires suitable blank, reference, wavelength, baseline, calibration, sample preparation and instrument performance. Spectral similarity supports identity but should be combined with orthogonal evidence when specificity matters.
Analytical workflow
- Define the analyte, matrix and intended analytical question.
- Select a method whose selectivity, sensitivity and range fit the purpose.
- Prepare representative standards, blanks, controls and samples.
- Verify instrument performance and system suitability.
- Acquire data with controlled conditions and traceable settings.
- Interpret the result with uncertainty, limitations and documentation.
Pharmacist and quality correlation
Analytical results support identity, assay, purity, stability, dissolution, impurity control and release decisions. A result is meaningful only when sampling, method, calibration, equipment, calculations and data integrity are controlled. Exact acceptance criteria and validation requirements must be checked against the current pharmacopoeia, ICH guidance and applicable regulator.
Tips, FAQs and takeaways
- Why is method selection important? No method is universally best; performance must match the analytical purpose.
- Why are standards and blanks needed? They separate analyte response from background, drift and contamination.
- What is the main takeaway? Treat every result as evidence produced by a controlled measurement system.
References: PharmacoLearn Year 3 syllabus; Pharmacy Council of India, Pharm.D. Regulations 2008; USP general analytical chapters; Skoog et al., Fundamentals of Analytical Chemistry; Beckett and Stenlake, Practical Pharmaceutical Chemistry; current ICH and pharmacopoeial guidance.
Document raw spectra and interpretation. Review the calibration model. Protect interpretation integrity. Spectroscopy is interpretation. Verify before conclusion. Trace every spectrum. Review specificity. Control background. Interpret cautiously. Preserve context. Always document.
Diagrams
Other Year 3 subjects: Pharmacology II · Pharmaceutical Analysis · Pharmacotherapeutics II · Pharmaceutical Jurisprudence · Medicinal Chemistry · Pharm D Year 3, Pharmaceutical Formulations · Year 3 · Pharm D