
← Medicinal Biochemistry practicals | Pharm.D. Year 1 Practicals
Effect of pH and Temperature on Amylase Activity
1. Aim
To compare amylase activity under different pH and temperature conditions while changing one variable at a time. PCI lists a single experiment on factors affecting enzyme activity, specifying pH and temperature. The college manual separates these into two demonstrations; this page combines them under the one PCI syllabus item. [1, 2]
2. Requirements
Use characterized starch substrate, an approved amylase source, buffer solutions with measured pH, temperature-controlled baths, timer, an approved starch or reducing-sugar indicator method, labelled tubes, pipettes, thermometer, protective equipment, and waste containers. The college manual uses saliva and a DNS color reagent. Enzyme source, reagent composition, pH points, temperatures, volumes, incubation, calibration, and controls must follow your college lab manual and instructor's method sheet from the instructor's current protocol. If saliva is used, apply biological-specimen handling rules. [2, 3]
3. Theory
An enzyme's observed rate depends on conditions that influence substrate binding and protein structure. pH can change the charge of groups involved in catalysis. Temperature can alter reaction rate and, if sufficiently high, reduce activity through loss of functional structure. A measured optimum belongs to the specific enzyme preparation and assay conditions, not to all amylases. The college manual has inconsistent wording and generalized optimum values, so no universal optimum is stated here. [2]
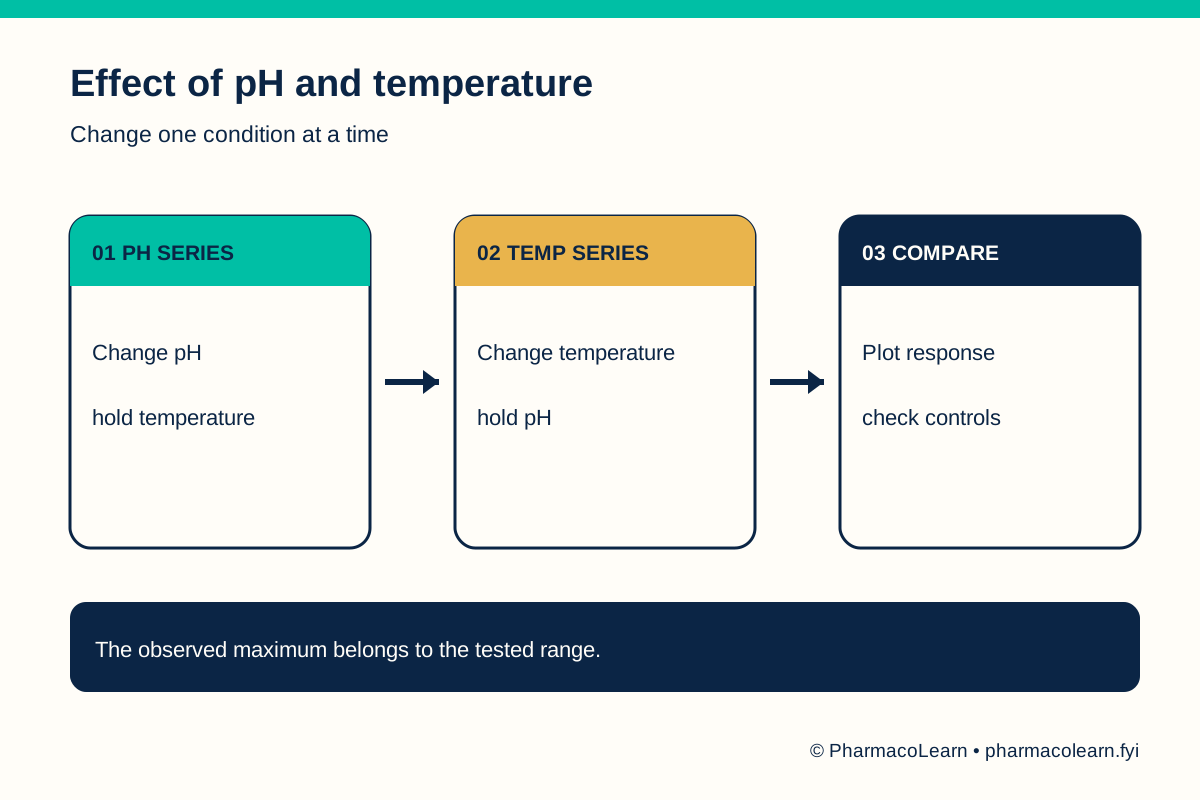
The pH comparison must hold temperature, enzyme amount, substrate amount, and observation time constant. The temperature comparison must hold pH and the other factors constant. A color signal can be used only after a valid standard or control relates it to starch remaining or product formed. The DNS procedure in the manual appears to add a stopping reagent at a step described as starting the reaction; the sequence must follow your college lab manual and instructor's method sheet before physical work. [2, 3]
4. Procedure
- Obtain the instructor's approved method and define the measured response: starch remaining, product amount, or activity rate. Record the response direction. [2]
- Verify the pH of the buffer set with a calibrated meter. Record actual pH values and the common incubation temperature here until measured. [2]
- Prepare matched pH-condition tests plus a no-enzyme or heat-inactivated control according to the approved method. Start timing at the defined reaction step. [2]
- Stop and read each pH test by the validated indicator method. Record raw color or absorbance and check control validity. [2]
- For the temperature series, keep pH, enzyme and substrate amounts, and reaction duration fixed. Measure the actual bath temperatures rather than using nominal labels. [2]
- Record responses for each temperature condition. Use a verified calibration curve if the response is to be expressed as product formed. [2]
- Plot response against measured pH and against measured temperature on separate axes. Identify only the highest observed response within the tested range, and note that a wider optimum remains Record here. [2, 3]
5. Calculation, graph, or images as appropriate
| Series | Condition varied | Conditions held fixed | Measured response |
|---|---|---|---|
| pH comparison | Measured pH Record here | Temperature, enzyme, substrate, time | Record here |
| Temperature comparison | Measured temperature Record here | pH, enzyme, substrate, time | Record here |
| Controls | No active enzyme or method control | Matched assay conditions | Record here |
Worked comparison calculation: If a product amount P is obtained after a common reaction time t, the average formation rate is P divided by t. For two conditions measured over the same t, their rate ratio is (P2 ÷ t) divided by (P1 ÷ t) = ** P2 ÷ P1 **. This cancellation works only when time and calibration are identical. Actual P values and method-specific response factors must follow your college lab manual and instructor's method sheet; no optimum is invented. [2]
6. Result
Report the two response plots, valid controls, and highest observed condition in each tested set only after actual measurements are supplied. Do not call a single observed peak a universal optimum. Record measured pH and temperature here; obtain assay calibration data from the approved local method. [2, 3]
7. References
- Pharmacy Council of India. Pharm.D. Regulations, 2008, Medicinal Biochemistry practical list.
- East Point College of Pharmacy. Medicinal Biochemistry Practical Manual, effects of pH and temperature on amylase.
- North Carolina State University. Enzymatic Digestion of Starch by Amylase: Lab Guide.
Back to Medicinal Biochemistry practicals | Pharm.D. Year 1 Practicals · All Pharm D Practicals · Pharm D
Theory notes: Medicinal Biochemistry