
← Human Anatomy and Physiology Practicals
Effect of temperature on a muscle curve
1. Aim
To compare labelled gastrocnemius twitch traces recorded under different temperature conditions in an approved simulation or instructor-supplied record, and describe changes in timing and response height without assuming a fixed outcome. [1, 2]
2. Requirements
An instructor-approved simulation or archived trace set with temperature labels, stimulus markers, time and response axes; a display or printed traces; a ruler or cursor tool; and an observation sheet. An instructor may also show the historical kymograph, tissue bath, thermometer, and stimulator as inactive apparatus. The trace source, actual temperatures, recording mode, calibration, stimulus settings, and any biological-material authorization are specified in your college lab manual and instructor's method sheet. Students do not prepare or heat animal tissue from this article. [2, 3, 4]
3. Theory
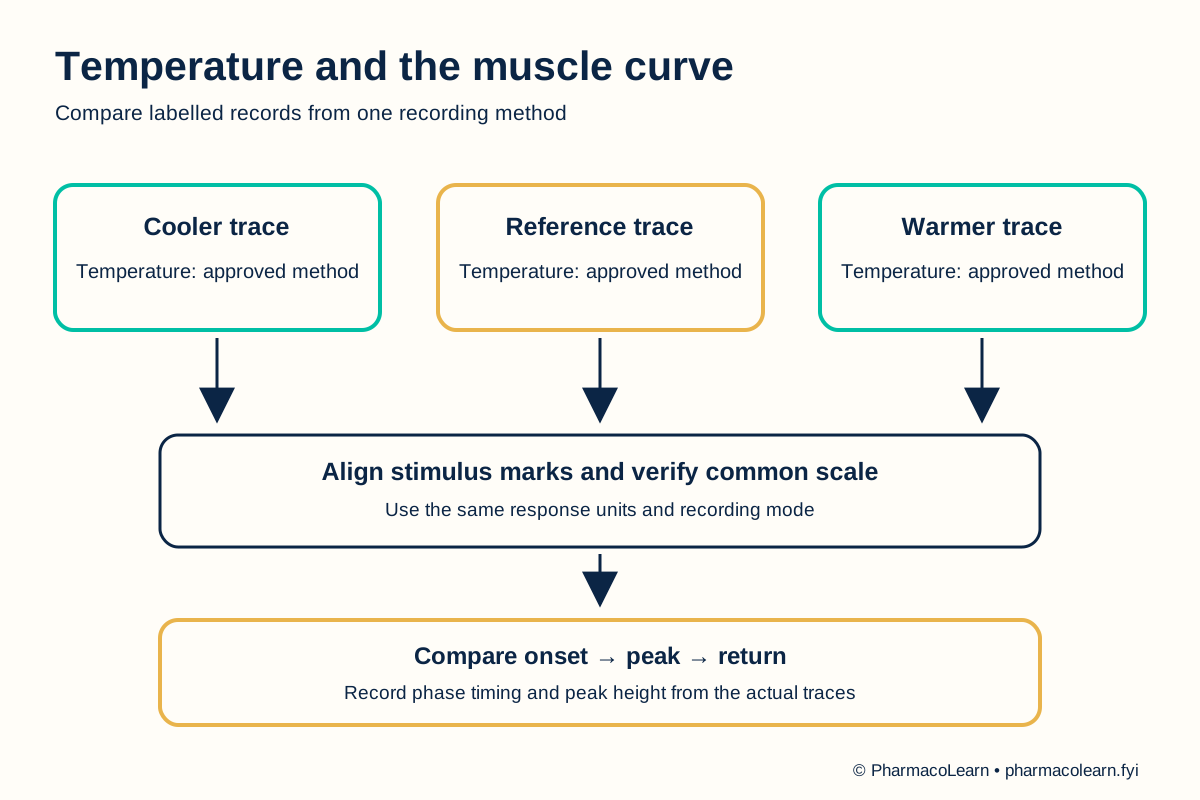
Temperature can change the rates of processes involved in a muscle twitch. A useful comparison examines stimulus-to-onset time, rise to peak, relaxation toward baseline, and response height at each labelled temperature. Cooling often slows development and relaxation, while warmer conditions can make these phases faster within the tested range. The peak may not change in the same direction across isotonic shortening and isometric force recordings, so it must be read from the assigned traces rather than predicted. Comparisons require the same recording mode, stimulus arrangement, and axis scale. [2, 3]
4. Procedure
- Obtain an approved simulation or archived set of traces labelled by temperature. Any biological preparation requires separate institutional authorization and trained personnel. The approved source and procedure are specified in your college lab manual and instructor's method sheet. [4]
- Identify the recording mode, response units, time axis, stimulus marker, baseline, and temperature label for each trace. If any is missing, mark that field as unresolved and ask the instructor before comparing. [2, 3]
- If using a simulation, select the instructor's specified reference, cooler, and warmer conditions while keeping the other permitted settings the same. All temperatures and stimulus settings are specified in your college lab manual and instructor's method sheet. Do not improvise a heating method. [2]
- Align the traces at the stimulus marker and compare only records with the same axis calibration. Mark response onset, peak, and return toward baseline on each trace. [2]
- Read the latent, contraction, and relaxation intervals from the calibrated time axes. Read peak height in the displayed response units. Record any trace that does not return to baseline or contains noise as a limitation. [2, 3]
- Compare cooler and warmer records with the reference. State the observed direction of change for each feature. Do not infer a normal value or an exact temperature effect from the schematic diagram. [2, 3]
- Save or submit the annotated traces and table. Follow the college lab manual and instructor's method sheet for record format and biological-material disposal. [4]
5. Calculation, graph, or images as appropriate
Use actual temperature and axis labels from the assigned record. No temperatures, durations, or normal values are invented here. [2]
| Record | Temperature | Latent interval | Rise-to-peak interval | Relaxation interval | Peak response |
|---|---|---|---|---|---|
| Cooler condition | Record here | Record here | Record here | Record here | Record here |
| Reference condition | Record here | Record here | Record here | Record here | Record here |
| Warmer condition | Record here | Record here | Record here | Record here | Record here |
Calculation: For each trace, latent interval = onset time minus stimulus time; rise-to-peak interval = peak time minus onset time; relaxation interval = return time minus peak time. Compare the same interval across two temperature labels by subtraction. Actual measurements and units must be recorded here. [2]
6. Result
Temperature-labelled traces compared and observed differences in phase timing and peak response: Record here. Report the recording mode and limitations alongside the comparison. [2, 3]
7. References
- Pharmacy Council of India. Pharm.D. Regulations, 2008, Appendix A. Lists the temperature-effect practical using a gastrocnemius sciatic-nerve preparation.
- Baze University. Physiology Handbook, Experiment 17: Effect of Temperature on the Behaviour of Frog's Muscle. Temperature-labelled curves and measured features.
- McPherson DR. Temperature Effects on Skeletal Muscle Contraction: An Investigative Lab in Animal Physiology. Society for Integrative and Comparative Biology abstract. Isometric force observations and temperature dependence.
- Committee for Control and Supervision of Experiments on Animals. Acts, Rules and Guidelines. Institutional animal-use oversight.
Back to Human Anatomy and Physiology Practicals · All Pharm D Practicals · Pharm D
Theory notes: Human Anatomy and Physiology