
← Human Anatomy and Physiology Practicals
Recording and analysis of a simple summation curve
1. Aim
To compare an isolated twitch with a paired-stimulus trace from an approved sciatic-gastrocnemius simulation or instructor-supplied record and identify when a second response adds to the first. [1, 2]
2. Requirements
An instructor-approved simulation or archived nerve-muscle recording with a time axis and stimulus markers; a display or printed traces; a ruler or cursor tool; and an observation sheet. If an apparatus is demonstrated, the instructor may show a stimulator, electrodes, transducer or myograph, and recorder. The trace source, interval settings, response scale, and any authorization for biological material are specified in your college lab manual and instructor's method sheet. Students do not prepare an animal or tissue from this article. [2, 3, 4]
3. Theory
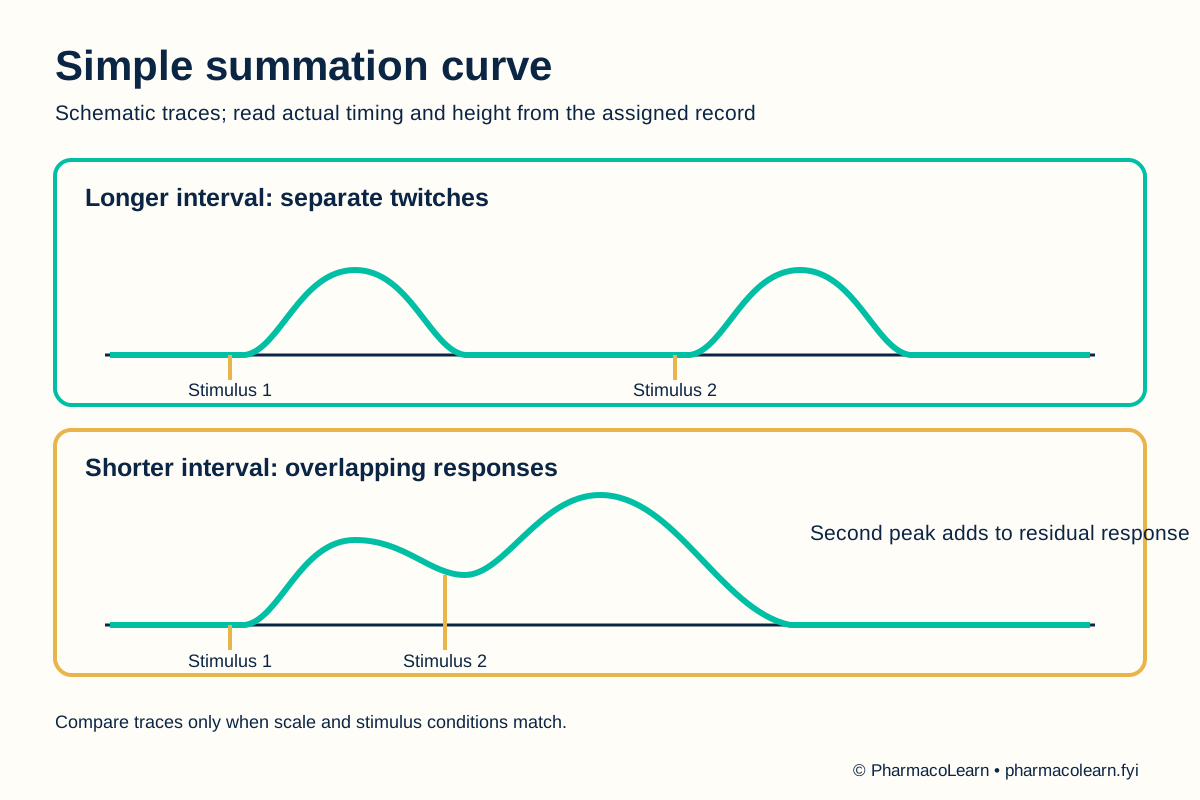
A single effective stimulus produces one twitch with a rise and relaxation. When a second stimulus arrives after the first twitch has ended, the responses can appear separate. When it arrives before complete relaxation, the second mechanical response can be added to residual tension, producing a taller combined response in the same recording system. This is temporal or wave summation. A paired response must not be confused with motor-unit recruitment caused by changing stimulus strength. Compare traces only when the recording scale and other conditions are comparable. [2, 3]
4. Procedure
- Obtain an approved simulation or instructor-supplied trace set with an isolated twitch and paired-stimulus records. Any use of biological material requires separate institutional authorization, trained personnel, and animal-welfare procedures. The local approval and material source are specified in your college lab manual and instructor's method sheet. [4]
- Check that each trace shows its stimulus markers, baseline, time direction, and response axis. Record whether the y-axis is force or shortening. Record the calibration and units here. [2, 3]
- If using a simulation, generate a single-stimulus reference trace with the instructor's specified settings. Then obtain paired-stimulus traces at a longer and a shorter interval while keeping the other settings fixed. Record the actual intervals and settings here; do not invent pulse values. [2]
- If using archived traces, order them by the labelled separation between stimulus markers. Identify whether the first twitch has returned to baseline before the second stimulus in each record. [2]
- On each trace, mark the first and second stimulus, the first response, any residual tension at the second stimulus, and the highest response after it. Ask the instructor to resolve any unclear marker or baseline. [2, 3]
- Compare the later peak with the isolated-twitch peak on the same response scale. State whether the two responses are separate, partly summed, or not interpretable from the record. Do not label a trace as summation solely because two stimulus marks are present. [2]
- Save or submit the annotated traces and table. Follow the college lab manual and instructor's method sheet for record format and biological-material disposal. [4]
5. Calculation, graph, or images as appropriate
Use the calibrated trace supplied. The example below describes a pattern, not measured values or a normal response. [2]
| Record | First twitch returned to baseline before second stimulus? | Later peak compared with isolated reference | Interpretation |
|---|---|---|---|
| Isolated twitch | Not applicable | Reference | Single response |
| Longer stimulus interval | Record here | Record here | Record here |
| Shorter stimulus interval | Record here | Record here | Record here |
Calculation, if the scale is available: Interstimulus interval = time of second stimulus minus time of first stimulus. Peak difference = peak of paired trace minus peak of isolated reference, using the same axis units and baseline convention. Record the actual values and units here. A shorter interval that places stimulus two before full relaxation, with a larger combined peak, supports summation. [2, 3]
6. Result
Traces compared, stimulus intervals, response-axis units, and presence or absence of summation: Record here. State whether the record came from a simulation or archived preparation. [2]
7. References
- Pharmacy Council of India. Pharm.D. Regulations, 2008, Appendix A. Lists the simple summation curve using a gastrocnemius sciatic-nerve preparation.
- Monash University. Skeletal Muscle Experiments: Summation. Paired stimuli and comparison of separated and overlapping twitches.
- William Paterson University. Animal Physiology Lab Manual, Lab 6: Frog Leg Muscle Contraction. Temporal summation and recording context.
- Committee for Control and Supervision of Experiments on Animals. Acts, Rules and Guidelines. Institutional animal-use oversight.
Back to Human Anatomy and Physiology Practicals · All Pharm D Practicals · Pharm D
Theory notes: Human Anatomy and Physiology