
← Human Anatomy and Physiology Practicals
Recording and analysis of a simple muscle curve
1. Aim
To obtain or examine a single gastrocnemius muscle twitch trace after one sciatic-nerve stimulus in an approved teaching simulation or instructor-supplied record, and identify its latent, contraction, and relaxation phases. [1, 2]
2. Requirements
An instructor-approved digital simulation or archived sciatic-gastrocnemius recording; a display or printed trace with stimulus marker and time axis; a ruler or cursor tool; an observation sheet; and, for an apparatus demonstration, a stimulator, electrodes, myograph or transducer, and recording interface. The simulation or trace source, time calibration, stimulus settings, and any institutional authorization for biological material are specified in your college lab manual and instructor's method sheet. Students do not prepare an animal or tissue from this article. [2, 3, 4]
3. Theory
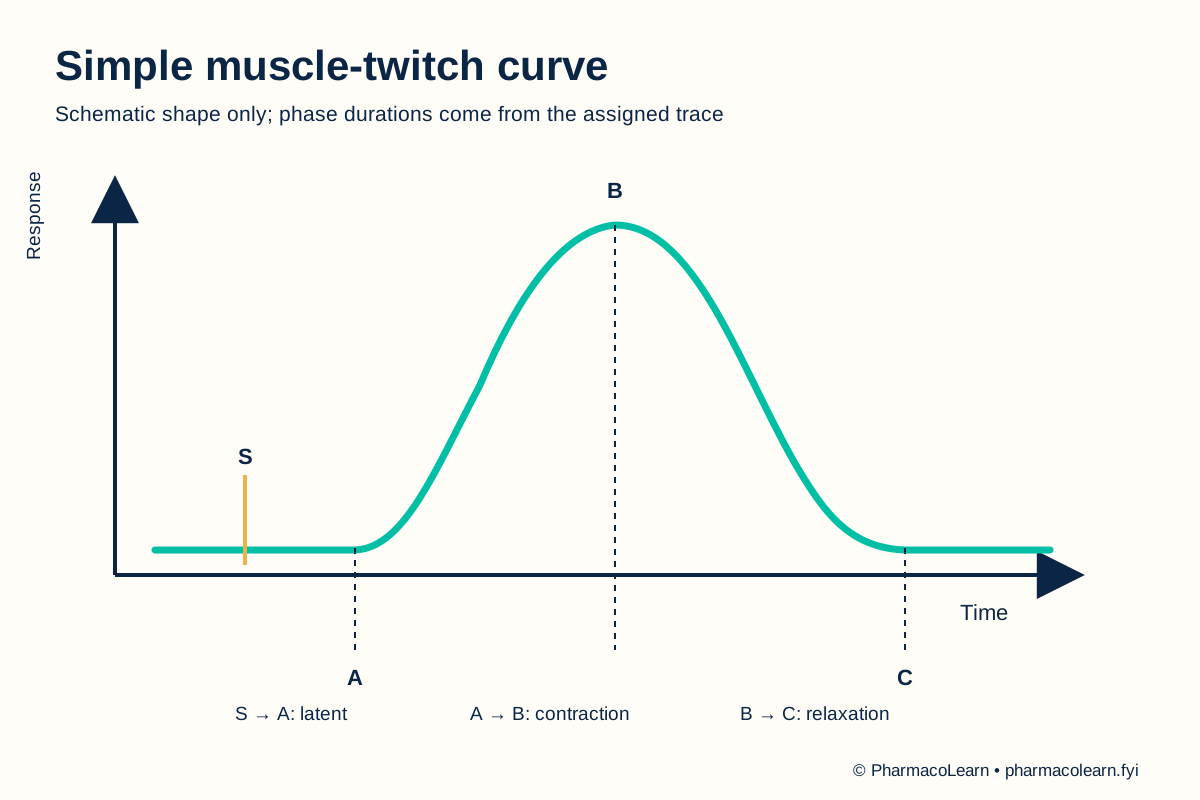
A single effective nerve stimulus can produce one brief gastrocnemius contraction, or twitch. On a time trace, the stimulus marker comes first. The interval from that marker to the first detectable rise is the latent period. The rising part of the curve is the contraction phase; the descent back toward baseline is the relaxation phase. A mechanical recorder or transducer converts the muscle response into a visible trace. The shape can change with loading, recording system, and stimulus conditions, so the phases should be identified from the actual trace rather than a memorized duration. [2, 3]
4. Procedure
- The instructor provides an approved simulation or archived trace with its source and time scale. If any live biological preparation is proposed, the institution must confirm applicable approval, trained personnel, and animal-welfare procedures before it is used. That authorization is specified in your college lab manual and instructor's method sheet. [4]
- Open the assigned simulation or display the supplied trace. Check the axis labels, recording direction, baseline, and stimulus marker. Record the source and time calibration here. [2, 3]
- If the approved simulation allows generating a trace, use only the instructor's specified single-stimulus setting and record one response. Do not invent a voltage, pulse width, load, or repetition rate. The setting is specified in your college lab manual and instructor's method sheet. [2, 3]
- Mark four points on the trace: S, stimulus; A, first detectable rise; B, peak; and C, return to baseline. If the rise or return is unclear, mark the point as unresolved and ask the instructor to review it. [2]
- Label S to A as latent period, A to B as contraction, and B to C as relaxation. Use the trace's calibrated time axis for any duration calculation. [2]
- Compare the trace with the labelled teaching diagram. Note if the trace has noise, drift, multiple peaks, or an unclear stimulus mark. Do not report a numerical phase duration unless the time scale is supplied and readable. [2, 3]
- Save or submit the annotated trace and observation table as instructed. Follow the college lab manual and instructor's method sheet for record format and biological-material disposal. [4]
5. Calculation, graph, or images as appropriate
Use the actual marked positions and the trace's calibrated time axis. No unsourced duration or normal value is provided. [2]
| Mark | Meaning | Time read from assigned trace |
|---|---|---|
| S | Stimulus marker | Record here |
| A | First detectable rise | Record here |
| B | Peak of twitch | Record here |
| C | Return to baseline | Record here |
Calculation: Latent period = A minus S. Contraction duration = B minus A. Relaxation duration = C minus B. For example, if an annotated trace labels the points S, A, B, and C in that order, the S to A interval is latent even when its numerical duration is not yet known. The actual durations must be recorded here. [2]
6. Result
Single-twitch trace examined or generated: Record here. Stimulus mark, onset, peak, return, and measurable phase durations: Record here. State whether the record came from simulation or an archived preparation. [2, 3]
7. References
- Pharmacy Council of India. Pharm.D. Regulations, 2008, Appendix A. Lists the simple muscle curve using a gastrocnemius sciatic-nerve preparation.
- Mohanlal Sukhadia University. Practical Zoology: Vertebrate, experimental physiology section. Simple twitch curve and its labelled phases.
- William Paterson University. Animal Physiology Lab Manual, Lab 6: Frog Leg Muscle Contraction. Nerve-muscle stimulation and recording concepts.
- Committee for Control and Supervision of Experiments on Animals. Acts, Rules and Guidelines. Institutional oversight and animal-use guidance.
Back to Human Anatomy and Physiology Practicals · All Pharm D Practicals · Pharm D
Theory notes: Human Anatomy and Physiology