
MPH101T — Modern Pharmaceutical Analytical Techniques
4 hrs/week, 4 credits, 60 hours, 100 marks. Notes follow the M.Pharm syllabus, unit by unit.
MPH101T Modern Pharmaceutical Analytical Techniques notes for M.Pharm Semester 1 Pharmaceutics: UV-Visible, IR, NMR, mass spectroscopy, chromatography, electrophoresis and thermal techniques with free unit wise PDF downloads on PharmacoLearn.
Units in this subject
- Unit 1 — UV-Visible, IR, Spectrofluorimetry, Flame Emission and Atomic Absorption Spectroscopy
- Unit 2 — NMR Spectroscopy
- Unit 3 — Mass Spectroscopy
- Unit 4 — Chromatography
- Unit 5 — Electrophoresis, X-Ray Crystallography, Immunological Assays, Potentiometry and Thermal Techniques
Download MPH101T PDF Notes
Free PDFs for this subject, one per unit:
Modern Pharmaceutical Analytical Techniques, subject code MPH101T, is the common Semester 1 subject of M.Pharm. The same subject is coded MPC101T in Pharmaceutical Chemistry and MPL101T in Pharmacology, and the syllabus is the same for Pharmaceutics, Pharmacology and Pharmaceutical Chemistry students. It carries 4 credits and 60 hours of theory.
This subject teaches the advanced instruments used to identify, characterise and quantify drugs and excipients, in bulk drug, in single and combination dosage forms, and in biological samples. A student who completes it should be able to choose the right technique for a given analytical problem, explain how the instrument works, and interpret the spectrum, mass spectrum or chromatogram it produces. The five units move in a logical order: first the spectroscopic methods that work on absorption and emission of radiation, then NMR, then mass spectroscopy, then the separation science of chromatography, and finally electrophoresis, X-ray crystallography, immunological assays and the electroanalytical and thermal methods.
Unit 1: UV-Visible Spectroscopy, IR Spectroscopy, Spectrofluorimetry, Flame Emission and Atomic Absorption Spectroscopy
1.1 UV-Visible spectroscopy: introduction and theory
UV-Visible spectroscopy is an absorption spectroscopy. It measures how much ultraviolet radiation (200 to 400 nm) and visible radiation (400 to 800 nm) a sample absorbs at each wavelength. Absorption happens when a photon promotes an electron of the molecule from a lower energy state to a higher energy state. The energy of the photon must exactly match the energy gap between the two states, which is given by E = hv, where h is Planck constant and v is the frequency of the radiation.
The electronic transitions involved, in order of decreasing energy, are sigma to sigma star, n to sigma star, pi to pi star and n to pi star. The pi to pi star and n to pi star transitions matter most in drug analysis because most drugs contain double bonds, aromatic rings or lone pair bearing groups such as carbonyls and amines. A group that absorbs UV or visible radiation is called a chromophore, for example C=C, C=O, N=N and the benzene ring. A group that does not absorb itself but shifts or intensifies the absorption of a chromophore is called an auxochrome, for example OH, NH2 and SH groups attached to the chromophore.
Four terms describe any absorption band:
- Wavelength of maximum absorption (lambda max): the wavelength absorbed most strongly, characteristic of the chromophore.
- Molar absorptivity (epsilon): the absorbance of a 1 molar solution in a 1 cm cell at lambda max, a measure of how strongly the compound absorbs.
- Bathochromic shift: shift of lambda max to longer wavelength (red shift), caused by conjugation or a polar solvent acting on an n to pi star transition in the reverse way described below.
- Hypsochromic shift: shift to shorter wavelength (blue shift). Hyperchromic effect means increased intensity and hypochromic effect means decreased intensity of the band.
1.2 Laws of UV-Visible spectroscopy
Two laws govern quantitative work.
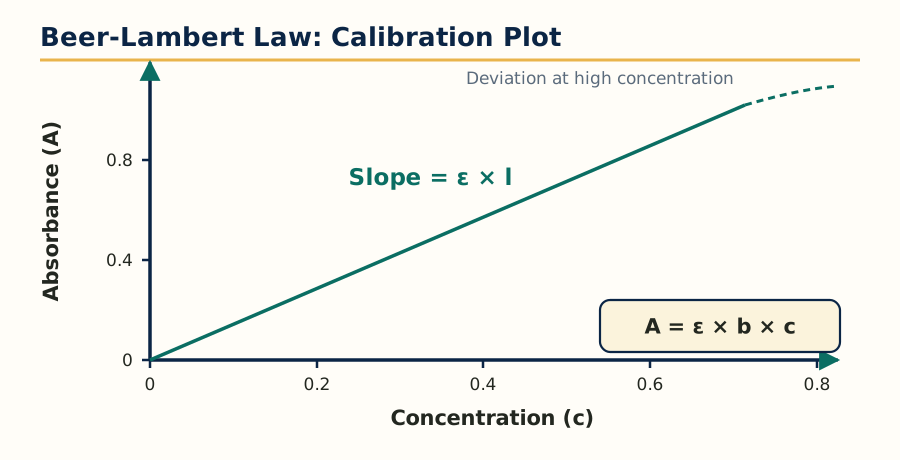 Figure: Beer-Lambert law calibration plot, absorbance is directly proportional to concentration.
Beer law states that when monochromatic radiation passes through a solution of an absorbing substance, the absorbance is directly proportional to the concentration of the absorbing substance. Lambert law states that the absorbance is directly proportional to the path length of the cell. Combined, the Beer-Lambert law is written as:
A = epsilon x b x c
where A is absorbance (no units), epsilon is molar absorptivity in L mol-1 cm-1, b is path length in cm and c is concentration in mol/L. Absorbance and transmittance are related by A = 2 minus log10 of percentage transmittance, or A = log10(I0/I), where I0 is incident intensity and I is transmitted intensity.
The law holds only under certain conditions, and its deviations are a favourite exam topic:
- The radiation must be monochromatic and the solution must be dilute.
- The solute must not associate, dissociate, react with the solvent or change with pH in a way that changes the absorbing species. These are chemical deviations.
- Polychromatic radiation, stray light and mismatched cells cause instrumental deviations, which are worst at high absorbance.
- At high concentration, molecules sit close together, the refractive index changes and apparent absorbance falls below the expected value. This is a real deviation of the law itself.
In practice, absorbance between about 0.2 and 0.8 gives the most accurate readings, and a calibration curve of absorbance against concentration of a standard is used for assays.
1.3 Instrumentation of UV-Visible spectrophotometer
A UV-Visible spectrophotometer has five basic parts. The working flow is:
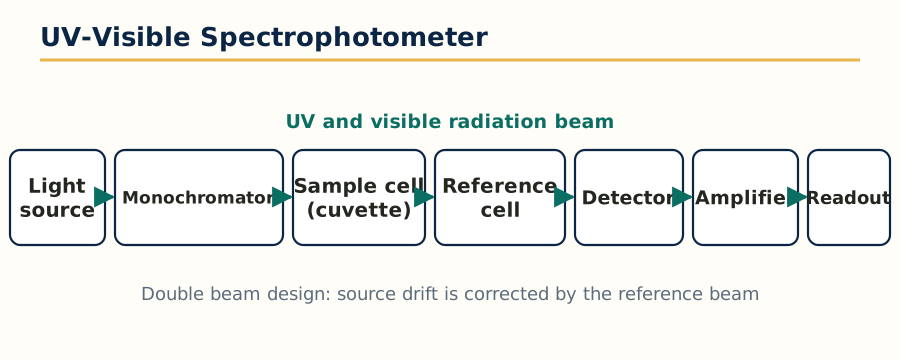 Figure: Parts of a UV-Visible spectrophotometer in the order of the light path.
Radiation source -> Monochromator (wavelength selector) -> Sample cell and Reference cell
-> Detector -> Amplifier and Readout (recorder or display)
- Radiation sources: a deuterium lamp (or hydrogen lamp) covers the UV region 200 to 375 nm, and a tungsten filament lamp covers the visible region 375 to 800 nm. A xenon arc lamp covers both regions and is used in some instruments.
- Monochromator: it isolates a narrow band of wavelengths. Entry slit, collimating mirror or lens, dispersing element and exit slit are its parts. The dispersing element is either a prism (glass for visible, quartz or fused silica for UV) or, more commonly today, a diffraction grating, which gives better resolution and a linear wavelength scale.
- Sample holders: cells or cuvettes of 1 cm path length. Quartz or fused silica cells are essential below 350 nm because glass absorbs UV strongly. Cells must be matched, clean and free of fingerprints on the optical faces.
- Detectors: the barrier layer (photovoltaic) cell is simple and needs no external power, the phototube is more sensitive, and the photomultiplier tube (PMT) is the most sensitive and is standard in research grade instruments. Modern instruments use photodiode and photodiode array detectors, which capture the whole spectrum at once.
- Single beam versus double beam: in a single beam instrument the blank and the sample are measured one after the other in the same cell position, so the instrument is simple but any drift affects the result. In a double beam instrument the light is split into sample and reference beams measured at the same time, which corrects for source fluctuations and solvent absorption automatically. Most pharmaceutical assays are done on double beam instruments.
1.4 Choice of solvents and solvent effects
The solvent must dissolve the sample, must not absorb in the region being measured, and must not react with the solute. Every solvent has a UV cut off wavelength below which it cannot be used; for example water and ethanol are transparent down to about 210 nm, while chloroform absorbs below about 245 nm and acetone below about 330 nm, so acetone is a poor solvent for UV work.
Solvent polarity shifts the bands in a predictable way:
- For pi to pi star transitions, a polar solvent stabilises the more polar excited state more than the ground state, the energy gap falls, and the band shows a bathochromic (red) shift.
- For n to pi star transitions, a polar solvent, especially a protic solvent like ethanol or water, hydrogen bonds with the lone pair and stabilises the ground state, the energy gap rises, and the band shows a hypsochromic (blue) shift.
pH is a special solvent effect of great practical use. Phenols in alkaline medium form the phenoxide ion, which absorbs at longer wavelength with higher intensity, while aniline in acid medium forms the anilinium ion, which loses the auxochrome effect and absorbs like benzene. This pH dependent shift is used in difference spectroscopy and in identifying ionisable drugs.
1.5 Applications of UV-Visible spectroscopy
- Quantitative assay of single drugs and of multi component formulations, using simultaneous equations, absorbance ratio method, dual wavelength method and derivative methods when spectra overlap.
- Determination of dissociation constant (pKa) of ionisable drugs from absorbance at different pH values.
- Determination of stoichiometry and stability constant of metal complexes by Job method of continuous variation and mole ratio method.
- Dissolution testing of tablets and capsules, where UV is the standard detector.
- Detection of impurities in a pharmacopoeial limit test sense, reaction monitoring, and as the detector of choice in HPLC (covered in Unit 4).
- Qualitative identification by lambda max and by comparison with a reference spectrum.
1.6 Difference and derivative spectroscopy
Difference spectroscopy records the difference in absorbance between two forms of the same sample, usually the sample at two different pH values or the sample against a reference containing the interfering excipients. Interferences that are identical in both cells cancel out, so the analyte can be measured even in a coloured or turbid formulation. It is used for assays in presence of degradation products and for pKa determination.
Derivative spectroscopy converts the normal (zero order) spectrum into its first, second or higher derivative with respect to wavelength. Overlapping bands that look like one broad hump separate into sharp features, and a shoulder becomes a clear peak. In practice it is used to resolve binary mixtures without a prior separation, to remove turbidity and background interference because a constant background disappears in the first derivative, and for fingerprint comparison. The amplitude of a derivative peak is proportional to concentration, so quantification is done by measuring the derivative amplitude at a wavelength where the other component crosses zero.
1.7 IR spectroscopy: theory and modes of molecular vibration
Infrared spectroscopy works on a different principle: molecules absorb IR radiation (conventionally 4000 to 400 cm-1 in the mid IR region) when the radiation frequency matches a vibrational frequency of a bond, and only if that vibration produces a change in the dipole moment of the molecule. Homonuclear molecules such as O2 and N2, whose vibration causes no dipole change, are IR inactive.
A molecule must first be understood as balls (atoms) joined by springs (bonds). The approximate vibrational frequency is given by Hooke law: stronger bonds and lighter atoms vibrate at higher frequency (higher wavenumber), which is why C-H stretching appears near 3000 cm-1 while C-Cl stretching appears near 700 cm-1.
The modes of molecular vibration are:
- Stretching vibrations, in which the bond length changes: symmetric stretching (both atoms move in the same sense) and asymmetric stretching (one bond shortens while the other lengthens).
- Bending vibrations, in which the bond angle changes: in plane bending, scissoring and rocking, and out of plane bending, wagging and twisting.
Not every vibration gives a separate peak. Some are degenerate (same energy, one band), some are too weak, some fall outside the instrument range, and some produce no dipole change. This is why the number of observed bands is usually less than the theoretical number of vibrational modes, which for a non linear molecule is 3N minus 6 and for a linear molecule is 3N minus 5, where N is the number of atoms.
Two regions of the IR spectrum should be read differently. The functional group region (4000 to 1500 cm-1) shows the characteristic stretching bands of groups such as OH, NH, C=O and C=C and is used to identify which functional groups are present. The fingerprint region (1500 to 400 cm-1) is crowded and unique for each compound, and identity is confirmed by matching the whole fingerprint of the sample with that of a reference standard, exactly as pharmacopoeias prescribe.
1.8 Sample handling in IR spectroscopy
Sample preparation depends on the state of the sample, and a wrong choice gives a useless spectrum:
- Solids: the KBr pellet method (about 1 mg sample ground with 100 mg dry KBr and pressed into a transparent disc) is the most common; the Nujol mull method (sample ground in liquid paraffin and placed between salt plates) is used when KBr may react or absorb moisture, noting that Nujol itself shows C-H bands; films cast from solution are used for polymers.
- Liquids: a thin film between two sodium chloride or potassium bromide plates, or a liquid cell of fixed path length. Water cannot be used as a solvent because it absorbs IR strongly and dissolves the salt plates.
- Gases: long path length gas cells (about 10 cm) with IR transparent windows.
- FT-IR sampling accessories: attenuated total reflectance (ATR) allows direct measurement of solids, pastes and liquids with almost no preparation and is now the routine method in quality control laboratories.
1.9 Instrumentation: dispersive IR and FT-IR
A dispersive IR spectrophotometer resembles a UV instrument: an IR source (Nernst glower, Globar or incandescent wire), a monochromator with gratings or prisms of salt optics, sample and reference compartments, and a detector such as a thermocouple, bolometer, Golay cell or pyroelectric detector. The spectrum is scanned wavelength by wavelength, so it is slow.
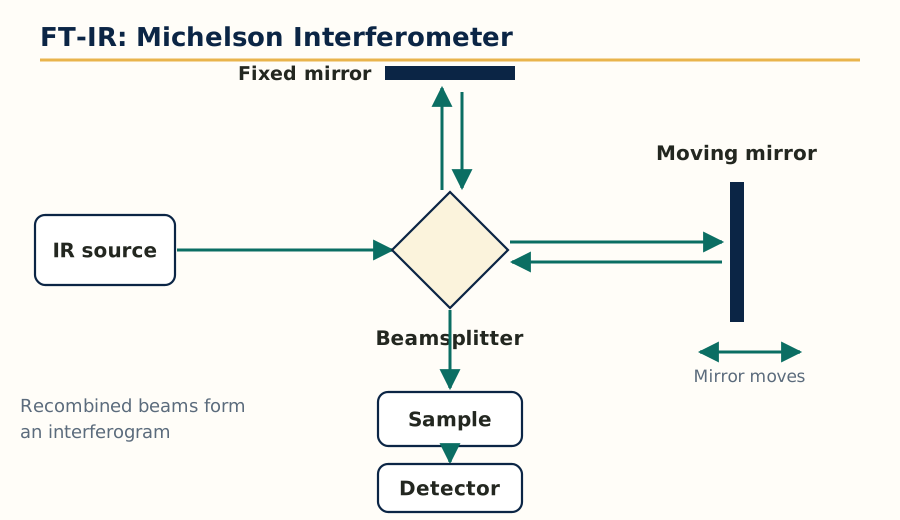 Figure: Michelson interferometer of an FT-IR spectrometer.
A Fourier transform IR (FT-IR) spectrometer replaces the monochromator with a Michelson interferometer. All frequencies reach the detector together as an interferogram, and a mathematical Fourier transform converts it into the spectrum. Its advantages are the classic exam answer:
- Fellgett advantage (multiplex): all wavelengths are measured simultaneously, so the spectrum is obtained in seconds with a better signal to noise ratio.
- Jacquinot advantage (throughput): no narrow slits, so more radiation reaches the detector and sensitivity is higher.
- Connes advantage: a helium neon laser references the mirror position, giving very accurate and reproducible wavenumber scale.
Because of these, FT-IR has replaced dispersive instruments almost completely.
1.10 Factors affecting vibrational frequencies
The observed position of an IR band shifts from its expected value because of:
- Coupled vibrations: two bonds sharing an atom interact, for example the two C=O stretches of an anhydride give two bands instead of one.
- Hydrogen bonding: intermolecular hydrogen bonding lowers the stretching frequency and broadens the band (the broad OH band of alcohols and carboxylic acids), while intramolecular hydrogen bonding sharpens it and shifts it in a concentration independent way.
- Electronic effects: electron withdrawing groups increase the bond force constant and raise the frequency (inductive effect), while conjugation lowers the C=O frequency because the double bond gets partial single bond character (mesomeric effect). Example: a saturated ketone absorbs near 1715 cm-1, an alpha beta unsaturated ketone near 1685 cm-1, an ester near 1735 cm-1 and an amide near 1650 cm-1.
- Bond angle and ring strain: in small rings the carbonyl frequency rises, for example cyclobutanone absorbs at higher wavenumber than cyclohexanone.
- Field effect: through space interaction of close substituents, seen in some ortho substituted compounds, and Fermi resonance, in which a fundamental band interacts with an overtone of another vibration and splits, as in the aldehyde C-H doublet near 2820 and 2720 cm-1.
1.11 Applications and data interpretation of IR spectroscopy
IR is mainly a qualitative and structural tool. Its uses are identification of drugs by fingerprint matching against pharmacopoeial reference spectra, detection of functional groups during structure elucidation (read together with NMR and mass spectra in Units 2 and 3), distinction of polymorphs because different crystal forms of the same drug give different IR spectra, study of drug excipient compatibility, and rapid raw material identification in quality control using ATR. A typical interpretation sequence is: check the carbonyl region first (1820 to 1630 cm-1, the strongest and most informative band), then OH and NH stretching (3600 to 3200 cm-1), C-H stretching (3300 to 2850 cm-1, position tells sp, sp2 or sp3 carbon), C=C and C=N (1680 to 1450 cm-1), and finally confirm with the fingerprint region.
1.12 Spectrofluorimetry: theory of fluorescence
Fluorescence is a type of photoluminescence. A molecule absorbs UV or visible radiation, an electron is promoted to an excited singlet state, it first loses some energy by vibration and collision (internal conversion) to reach the lowest vibrational level of the first excited singlet state, and then returns to the ground state by emitting a photon. Because some energy is lost before emission, the emitted light is always of longer wavelength (lower energy) than the absorbed light. This gap is called the Stokes shift, and it is what makes fluorescence measurement so sensitive: the signal is read against a dark background at a different wavelength, at 90 degrees to the excitation beam.
Related terms: phosphorescence is emission from a triplet state after intersystem crossing, it is slower and longer lived; quantum yield is the ratio of photons emitted to photons absorbed; fluorescence lifetime is the average time the molecule spends in the excited state, typically nanoseconds. A rigid, planar, highly conjugated molecule with electron donating groups usually fluoresces strongly, while heavy atoms, nitro groups and flexible structures reduce it.
1.13 Factors affecting fluorescence, and quenchers
- Structure: rigidity and planarity increase fluorescence; free rotation wastes energy as heat.
- Substituents: electron donating groups (OH, NH2, OCH3) increase fluorescence, electron withdrawing groups (NO2, COOH, halogens, especially iodine and bromine through the heavy atom effect) decrease it.
- pH: many fluorophores fluoresce in only one ionisation state; quinine fluoresces strongly in acid, while fluorescein fluoresces in alkaline medium. Assays must buffer the pH strictly.
- Solvent and temperature: increasing temperature increases collisions and decreases fluorescence, so temperature control matters. Dissolved oxygen is a strong quencher.
- Concentration: at high concentration the emitted light is reabsorbed by the sample itself (inner filter effect) and the calibration curve bends; fluorescence is linear only in dilute solution.
Quenching is any process that decreases fluorescence intensity. Quenchers include oxygen, halide ions, heavy metal ions, nitro compounds and the analyte itself at high concentration (self quenching). Dynamic (collisional) quenching happens during the excited state, static quenching happens when the quencher forms a non fluorescent ground state complex with the fluorophore.
1.14 Instrumentation and applications of spectrofluorimetry
The fluorimeter flow is:
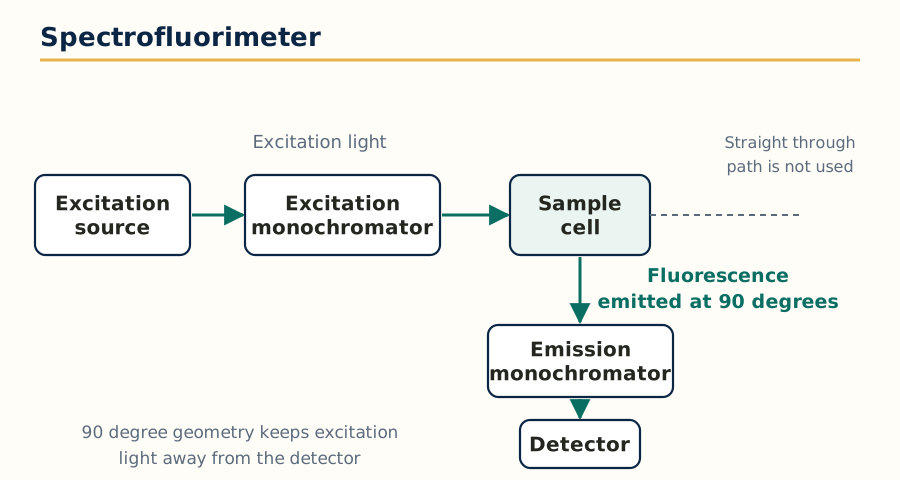 Figure: Spectrofluorimeter, emission is measured at 90 degrees to the excitation beam.
Excitation source (xenon arc or mercury lamp) -> Excitation monochromator
-> Sample cell -> (at 90 degrees) Emission monochromator -> Photomultiplier detector -> Readout
The 90 degree arrangement prevents excitation light from reaching the detector. A spectrofluorophometer has two monochromators, for selecting excitation and emission wavelengths separately, and quartz cells with all four faces polished. Applications: assay of low dose and inherently fluorescent drugs (quinine, riboflavin, tetracyclines after complexation), derivatisation based assays for non fluorescent drugs, analysis in biological fluids at nanogram levels where UV lacks sensitivity, stability studies, and as a highly sensitive and selective detector in HPLC. The main limitation is that only a minority of drugs fluoresce naturally, so many assays need a fluorescent tagging step.
1.15 Flame emission spectroscopy and atomic absorption spectroscopy
Both methods work on free atoms, not molecules, so the sample must first be converted into an atomic vapour, a process called atomisation, usually in a flame.
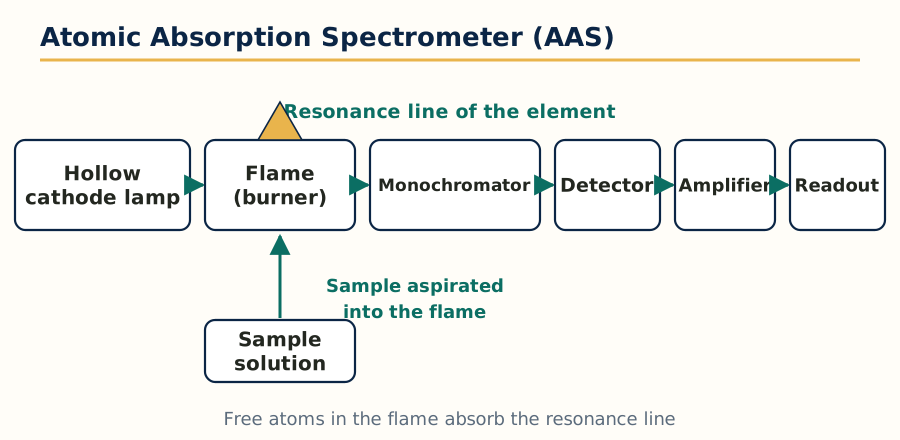 Figure: Atomic absorption spectrometer, the sample solution is aspirated into the flame.
Flame emission spectroscopy (flame photometry): the sample solution is aspirated into a flame, the solvent evaporates, the salt vaporises and dissociates into free atoms, and thermal energy of the flame excites some atoms. As they return to the ground state they emit light at characteristic wavelengths, whose intensity is proportional to concentration. It is the classic method for sodium, potassium, lithium and calcium. Instrumentation: sample aspiration and nebuliser, burner with fuel and oxidant gases (air propane for a cooler flame, air acetylene for hotter work), filter or monochromator to isolate the emission line, photocell detector and readout.
Atomic absorption spectroscopy (AAS): here the free atoms in the flame or in a graphite furnace absorb radiation from a lamp that emits the exact resonance line of the element being measured. The lamp is a hollow cathode lamp made of the same element, which is why AAS is highly specific but essentially one element at a time. The absorbance follows the Beer-Lambert type relationship with the number of ground state atoms, which is far larger and more stable than the number of excited atoms, so AAS is more sensitive and less temperature dependent than flame emission. In electrothermal (graphite furnace) AAS the sample is heated electrically in steps (drying, ashing, atomisation), giving detection at parts per billion level from microlitre samples. A background correction system, commonly deuterium lamp or Zeeman correction, corrects for non specific absorption by smoke and salts.
Interferences in flame methods are classified as: spectral interference (overlap of lines or bands), ionisation interference (easily ionised elements lose atoms as ions, suppressed by adding an excess of another easily ionised element such as potassium or caesium), chemical interference (formation of refractory compounds, for example calcium phosphate, removed by adding a releasing agent such as lanthanum or strontium, or by a protective chelating agent such as EDTA), and physical interference (viscosity and surface tension changing the aspiration rate, corrected by matrix matching of standards). Applications of AAS: assay of metallic impurities and catalysts residues, determination of elements such as zinc, iron, copper, lead and cadmium at trace level, and analysis of metals in biological samples. Unlike UV and IR, these atomic methods tell nothing about molecular structure, only which element and how much of it is present.
1.16 Unit 1 comparison tables
| Feature | UV-Visible | IR | Fluorescence |
|---|---|---|---|
| Radiation range | 200 to 800 nm | 4000 to 400 cm-1 | Excitation in UV or visible, emission at longer wavelength |
| Molecular event | Electronic transition | Bond vibration | Emission after electronic excitation |
| Main output | Lambda max and absorbance | Wavenumber of bands | Emission intensity at an emission wavelength |
| Best use | Quantitative assay | Identification, functional groups, fingerprint | Very sensitive assay of fluorescent drugs |
| Typical sensitivity | Microgram per mL | Milligram amounts | Nanogram per mL |
| Feature | Flame emission | Atomic absorption |
|---|---|---|
| Atoms measured | Excited atoms emitting light | Ground state atoms absorbing light |
| Light source | The flame itself | Hollow cathode lamp of the same element |
| Temperature dependence | High, flame must be stable | Low, more robust |
| Common use | Sodium, potassium, lithium, calcium | Trace metals and metallic impurities |
Unit 2: NMR Spectroscopy
2.1 Principle and quantum numbers
Nuclear magnetic resonance spectroscopy studies nuclei that possess spin. A nucleus with spin behaves like a tiny magnet with a magnetic moment. Whether a nucleus has spin is decided by its spin quantum number I:
- Nuclei with both mass number and atomic number even, such as carbon-12 and oxygen-16, have I = 0 and are NMR inactive.
- Nuclei with odd mass number, such as hydrogen-1, carbon-13, fluorine-19 and phosphorus-31, have half integral spin (I = 1/2 for the common ones) and are NMR active.
- Nuclei with even mass number but odd atomic number, such as hydrogen-2 and nitrogen-14, have integral spin (I = 1).
Proton NMR (1H NMR) is the workhorse because hydrogen-1 is present in almost every drug, has I = 1/2, high natural abundance and the highest sensitivity of common nuclei.
When a spinning nucleus is placed in an external magnetic field B0, it can align with the field (lower energy, alpha state) or against the field (higher energy, beta state). The nucleus precesses around the field axis at the Larmor frequency, which is directly proportional to the field strength and to the magnetogyric ratio of the nucleus. Resonance, the absorption of radiofrequency energy that flips the nucleus from alpha to beta, happens when the applied radiofrequency exactly equals the Larmor frequency. The tiny excess of nuclei in the lower state (only a few per million at ordinary field strengths) is what produces the signal, which is why NMR is an inherently insensitive technique compared with UV or mass spectroscopy.
2.2 Instrumentation of NMR spectrometer
The main parts are:
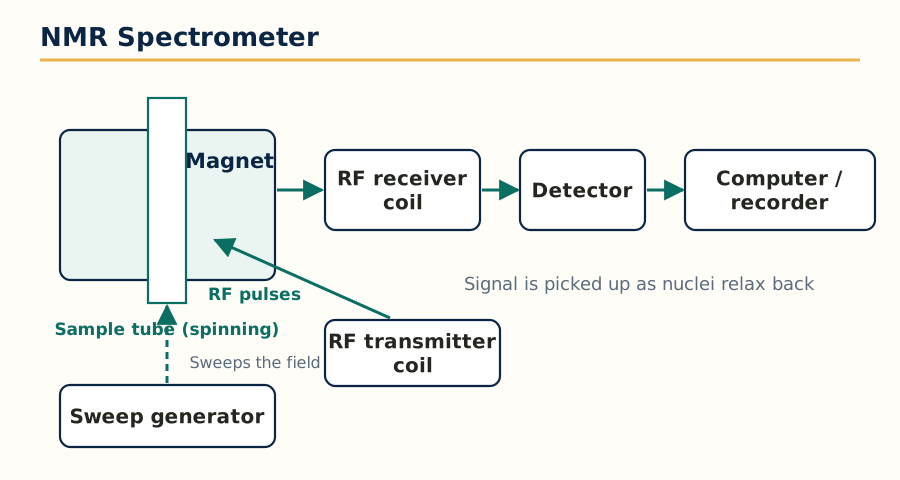 Figure: Main parts of an NMR spectrometer.
- Magnet: must give a very strong, perfectly homogeneous and stable field. Modern instruments use a superconducting magnet (niobium alloy coil cooled in liquid helium, with liquid nitrogen as an outer jacket) giving fields described by their proton frequency, for example 400 MHz or 600 MHz. Older instruments used permanent or electromagnets.
- Radiofrequency transmitter: generates the exact frequency needed to irradiate the sample, applied through a coil around the sample tube.
- Sample holder: a thin glass tube, usually 5 mm diameter, which is spun in the probe to average out field inhomogeneity in continuous wave instruments.
- Detector and receiver coil: picks up the weak signal emitted as nuclei relax back.
- Sweep generator and recorder or computer: in continuous wave (CW) NMR either the field or the frequency is swept slowly through the resonance conditions and a pen recorder draws the spectrum. In pulsed Fourier transform (FT) NMR all nuclei are excited together by a short powerful radiofrequency pulse, the free induction decay (FID) signal is collected, and a Fourier transform converts it into the normal frequency spectrum. FT NMR is the standard today because it is fast and allows signal averaging for dilute samples and for insensitive nuclei like carbon-13.
- Internal standard: tetramethylsilane (TMS) is added in a small amount. Its 12 equivalent protons give one sharp signal, it is chemically inert, miscible and volatile, and its signal appears at the extreme right of the spectrum where few other signals fall. Its position is defined as delta = 0 ppm.
2.3 Solvent requirement in NMR
The solvent must dissolve the sample, must not exchange protons with the solute in a confusing way, and above all must not give signals of its own in the proton spectrum. Therefore solvents without protons, such as carbon tetrachloride and carbon disulphide, or fully deuterated solvents are used: deuterated chloroform (CDCl3, the most common), deuterated DMSO (DMSO-d6, good for polar drugs and shows exchangeable OH and NH protons), deuterated methanol and heavy water (D2O). In D2O the OH, NH, SH and COOH protons exchange with deuterium and their signals disappear; this D2O exchange or D2O shake is a standard test to identify exchangeable protons in a spectrum.
2.4 Relaxation process
After the radiofrequency pulse, excited nuclei must return to equilibrium before the next pulse, and the ways they lose energy are called relaxation:
- Spin lattice relaxation (longitudinal, T1): the excess energy is transferred to the surrounding lattice (solvent and other molecules) as heat. It decides how quickly the experiment can be repeated.
- Spin spin relaxation (transverse, T2): nuclei exchange energy among themselves, which does not change total energy but causes the signals to lose phase coherence. It decides the width of the lines: short T2 means broad lines.
Solids and viscous samples relax by T2 very fast and give broad lines, which is why routine NMR is done in free flowing solutions. Paramagnetic substances such as dissolved oxygen or metal ions shorten relaxation times drastically and broaden signals, so samples are sometimes degassed.
2.5 NMR signals: number, position, area and splitting
A proton NMR spectrum gives four kinds of information, and exams test all four:
- Number of signals tells how many sets of chemically equivalent protons the molecule has. Protons in identical chemical environments are equivalent and absorb at the same position.
- Chemical shift (position of the signal) tells the electronic environment of those protons (Section 2.6).
- Integration (area under the signal) is proportional to the number of protons in that set. The integrator trace rises in steps whose heights are in the ratio of the proton counts.
- Splitting or multiplicity tells how many protons sit on neighbouring atoms (Section 2.7).
2.6 Chemical shift
The electrons around a nucleus shield it from the external field, so the field actually felt is slightly less than B0. Different environments shield to different extents, so signals appear at different positions. Chemical shift is expressed on the delta scale in parts per million (ppm):
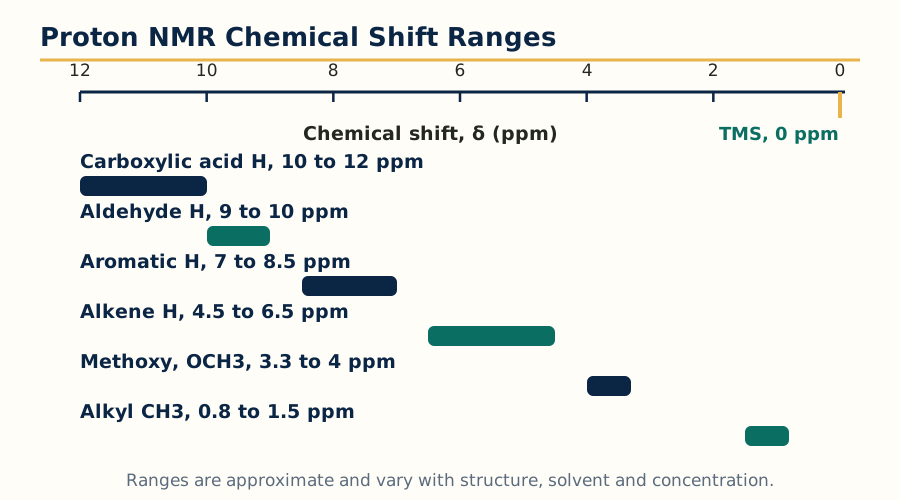 Figure: Approximate proton chemical shift ranges, TMS is the zero reference.
delta = (frequency of sample signal minus frequency of TMS signal, in Hz) divided by (operating frequency of the spectrometer, in Hz) x 10^6
Expressing shift in ppm makes it independent of the instrument: a proton at delta 7.3 on a 400 MHz instrument is also at delta 7.3 on a 600 MHz instrument, only its distance in Hz changes. Movement to higher delta (left, downfield) is called deshielding, movement to lower delta (right, upfield) is called shielding.
Approximate proton chemical shift regions worth memorising:
| Proton type | Typical delta (ppm) |
|---|---|
| Alkyl, CH3 and CH2 away from other groups | 0.9 to 1.5 |
| Allylic and benzylic protons | 1.7 to 2.6 |
| CH3 or CH2 attached to carbonyl (acetyl type) | 2.0 to 2.5 |
| Protons on carbon bearing O or N (OCH3, OCH2, NCH3) | 3.3 to 4.0 |
| Olefinic (alkene) protons | 4.5 to 6.5 |
| Aromatic protons | 6.5 to 8.5 |
| Aldehyde proton | 9.5 to 10.0 |
| Carboxylic acid proton | 10.5 to 12.0 |
| Alcohol and phenol OH, amine NH | Variable, about 0.5 to 5.5, concentration and solvent dependent |
2.7 Factors influencing chemical shift
- Electronegativity of the attached group: an electronegative atom such as oxygen or chlorine pulls electrons away, deshields the proton and moves it downfield. Compare CH3F (4.26), CH3Cl (3.05), CH3Br (2.68) and CH3I (2.16 ppm), which follows the electronegativity order exactly.
- Hybridisation: sp2 protons (alkene, aromatic, aldehyde) appear far downfield of sp3 protons; sp protons of terminal alkynes appear near 2 to 3 ppm because of a special anisotropy effect.
- Anisotropy (neighbour anisotropic effect): the pi electrons of double bonds, triple bonds, carbonyls and aromatic rings circulate under the field and create local fields that deshield protons in some zones and shield them in others. This explains the very downfield aldehyde proton (about 9.7 ppm), aromatic protons (about 7.3 ppm) and the unusually upfield alkyne proton.
- Hydrogen bonding: bonded OH and NH move downfield, and the shift increases with concentration and decreases on dilution or on heating, which distinguishes intermolecular from intramolecular hydrogen bonding.
- Van der Waals deshielding: in crowded molecules, a proton forced close to another bulky group is deshielded by electron cloud repulsion.
- Solvent and temperature: aromatic solvents such as benzene induce shifts, and exchangeable protons are the most sensitive to temperature.
2.8 Spin-spin coupling and coupling constant
A signal is split into a multiplet when the protons of that set have non equivalent protons on an adjacent atom. The neighbouring protons can align with or against the field, so the effective field at the observed nucleus takes several slightly different values. The rule is:
Multiplicity = (n + 1), where n is the number of equivalent neighbouring protons.
One neighbour gives a doublet, two give a triplet, three give a quartet. The relative intensities follow Pascal triangle: a triplet is 1:2:1 and a quartet is 1:3:3:1. Protons of the same set do not split each other, and in most drug like molecules coupling is significant only up to three bonds (geminal 2J on the same carbon when its protons are non equivalent, vicinal 3J on adjacent carbons, and long range 4J which is usually small, as in allylic or aromatic meta coupling).
The coupling constant J is the distance in Hz between the lines of a multiplet. Unlike chemical shift in Hz, J is independent of the operating frequency and of field strength, which helps in confirming that two multiplets are coupled to each other: partners share the same J value. Typical values: geminal about 12 to 15 Hz in magnitude, vicinal about 6 to 8 Hz for freely rotating chains (and dependent on dihedral angle by the Karplus relationship, large near 0 and 180 degrees, small near 90 degrees), cis alkene about 10 Hz, trans alkene about 15 to 18 Hz, ortho aromatic about 8 Hz, meta about 2 Hz and para about 0 to 1 Hz.
2.9 Nuclear magnetic double resonance and related techniques
In double resonance (spin decoupling), a second strong radiofrequency is applied at the resonance frequency of one nucleus while the spectrum is recorded. The irradiated protons are saturated and their coupling disappears from the spectrum, so a triplet may collapse to a singlet. This identifies which signals are coupled to which, and simplifies crowded spectra. The nuclear Overhauser effect (NOE), produced in a related double resonance experiment, increases the intensity of signals of nuclei that are close in space, and is used to establish stereochemistry and three dimensional closeness rather than through bond connection.
2.10 FT-NMR and 13C NMR: brief principles
FT-NMR: a short pulse containing all frequencies excites every nucleus of the chosen type at once. The resulting time domain signal, the FID, is the sum of decaying sine waves, and Fourier transformation converts it into the frequency domain spectrum. Advantages: the whole spectrum is obtained in seconds, many scans can be added to improve signal to noise (essential for dilute samples and weak nuclei), and quantitative and multi pulse experiments become possible.
13C NMR: carbon-13 has I = 1/2 but only about 1.1 percent natural abundance and a lower magnetogyric ratio, so it is roughly 6000 times less sensitive than proton NMR and needs FT operation with signal averaging. Its chemical shift range is wide, about 0 to 220 ppm, so overlap is rare and each chemically different carbon usually gives one line. In the routine broadband proton decoupled spectrum every carbon signal is a singlet, which makes counting carbons simple. Carbon types are located approximately as: alkyl carbons 5 to 45 ppm, carbons bearing O or N 50 to 90 ppm, alkene and aromatic carbons 100 to 150 ppm, and carbonyl carbons 160 to 220 ppm (esters and acids near 165 to 180, ketones near 195 to 220). Off resonance decoupling and DEPT experiments tell whether a carbon is CH3, CH2, CH or quaternary.
2.11 Applications of NMR spectroscopy
Complete structure elucidation of new drugs and impurities (with IR and mass data), confirmation of identity and purity, distinguishing isomers and tautomeric forms, quantitative NMR (qNMR) using an internal standard without needing a reference standard of the analyte itself, study of drug receptor and drug protein binding, determination of residual solvents in bulk drugs, and checking the ratio of components in a mixture from integration values.
Unit 3: Mass Spectroscopy
3.1 Principle and theory
Mass spectroscopy is a technique in which the sample is first converted into ions in the gas phase, the ions are separated according to their mass to charge ratio (m/z), and each ion type is counted. The record is a graph of relative abundance against m/z, called a mass spectrum. It is not a true absorption spectroscopy: no radiation is absorbed by the sample. No other single technique gives the molecular weight so directly, and, from the fragmentation pattern, strong clues to the structure.
Three results are read from almost every spectrum:
- The molecular ion peak (M+.): the ion formed by removal of one electron from the whole molecule without breaking it apart. Its m/z gives the molecular weight of the compound.
- The base peak: the tallest peak of the spectrum, assigned a relative abundance of 100 percent. It is usually the most stable fragment ion, not necessarily the molecular ion.
- Fragment ions and neutral losses: smaller peaks formed when the molecular ion breaks at its weaker bonds. The mass differences between peaks correspond to lost neutral fragments, for example loss of 15 (CH3), 18 (H2O), 28 (CO), 29 (C2H5 or CHO) and 31 (OCH3).
The nitrogen rule is a quick check: a molecule with an odd nominal molecular weight contains an odd number of nitrogen atoms, and a molecule with an even molecular weight contains zero or an even number of nitrogen atoms.
3.2 Instrumentation of mass spectrometer
The working flow of the instrument is:
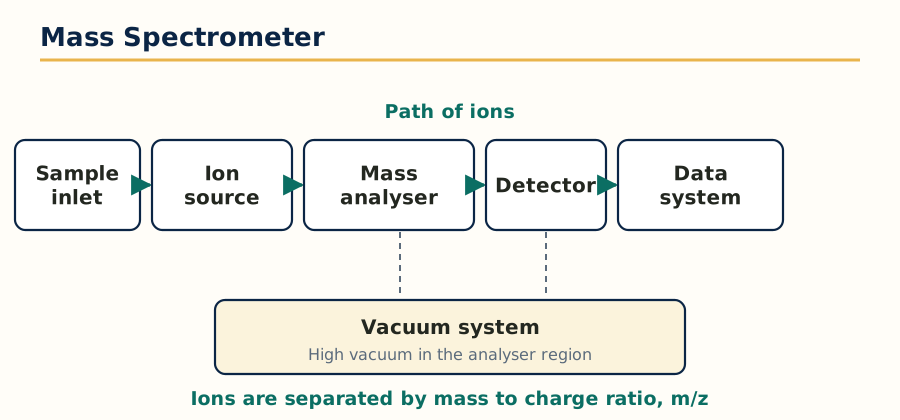 Figure: Main parts of a mass spectrometer along the path of the ions.
Sample inlet -> Ion source (ionisation chamber) -> Accelerating plates
-> Mass analyser (separates ions by m/z) -> Detector -> Amplifier -> Recorder or computer
        (the whole ion path is kept under high vacuum)
- Sample inlet: introduces the vaporised sample at a very low, steady pressure. For GC-MS and LC-MS the chromatograph itself is the inlet.
- Ion source: ionises the molecules by the chosen method (Section 3.3).
- Accelerator: charged plates give every ion the same kinetic energy, so that afterwards velocity depends only on mass.
- Analyser: separates the ions by m/z (Section 3.4).
- Detector: an electron multiplier converts each arriving ion into an amplified electrical pulse.
- Vacuum system: the ion path is kept at about 10^-5 to 10^-7 torr so that ions do not collide with air molecules and lose their path or energy.
3.3 Types of ionisation
Ionisation methods divide into hard methods, which fragment the molecule extensively, and soft methods, which give mainly the molecular ion or a simple adduct ion. Soft methods made mass spectroscopy usable for large, polar and heat sensitive drug molecules and biomolecules.
| Method | How ions are formed | Type | Best suited for |
|---|---|---|---|
| Electron impact (EI) | A beam of high energy electrons (usually 70 eV) knocks an electron out of the molecule | Hard | Volatile, thermally stable small molecules, GC-MS, gives rich fragmentation for structure work |
| Chemical ionisation (CI) | A reagent gas such as methane is ionised first, and its ions transfer a proton gently to the sample | Soft | Molecular weight confirmation, strong (M+H)+ peak, little fragmentation |
| Field ionisation and field desorption (FI, FD) | A very strong electric field at a sharp emitter removes an electron, or desorbs ions directly from the emitter | Soft | Non volatile and thermally labile compounds, very little fragmentation |
| FAB (fast atom bombardment) | A beam of fast argon or xenon atoms strikes the sample dissolved in a viscous matrix such as glycerol | Soft | Polar, non volatile molecules of moderate mass, peptides |
| MALDI (matrix assisted laser desorption ionisation) | The sample in a UV absorbing matrix is hit by a laser pulse, the matrix absorbs the energy and desorbs sample ions | Soft | Very large molecules, proteins, polymers, usually with a time of flight analyser |
| ESI (electrospray ionisation) | The liquid sample is sprayed through a charged capillary, droplets evaporate and leave multiply charged ions | Soft | LC-MS workhorse, polar and large molecules, proteins give a series of multiply charged peaks |
| APCI (atmospheric pressure chemical ionisation) | The LC effluent is vaporised by heat and ionised by a corona discharge at atmospheric pressure | Soft | Less polar, moderately sized molecules that respond poorly in ESI |
| APPI (atmospheric pressure photoionisation) | UV photons from a lamp ionise the vaporised sample, often with a dopant | Soft | Non polar compounds that neither ESI nor APCI ionises well |
3.4 Mass analysers: quadrupole and time of flight
An analyser separates ions of different m/z and passes one m/z at a time, or measures all of them by a physical property linked to mass.
Quadrupole analyser: four parallel metal rods carry combined direct current and radiofrequency voltages. For a given voltage setting, only ions of one m/z follow a stable oscillating path through the rods and reach the detector; all others strike the rods and are lost. Scanning the voltages scans the mass range. Quadrupoles are compact, relatively cheap, fast scanning and tolerant of higher pressure, which is why they dominate routine GC-MS, LC-MS and the triple quadrupole instruments used for drug quantification in plasma.
Time of flight (TOF) analyser: all ions are accelerated by the same voltage, so lighter ions move faster than heavier ones. There are no scanning parts: the time taken to drift down a field free tube to the detector gives the m/z directly. TOF has, in principle, an unlimited mass range and very high resolution in reflectron designs, and it pairs naturally with MALDI, where ions are made in pulses.
Other analysers to name in an exam answer: magnetic sector (the classical high resolution instrument, deflects ions in a magnetic field according to momentum), ion trap (stores ions in a three dimensional quadrupole field and ejects them by mass) and Fourier transform ion cyclotron resonance (highest resolution, measures the orbital frequency of ions in a magnetic field).
3.5 Mass fragmentation and its rules
Fragmentation is not random. The molecular ion breaks where the resulting cation is most stable, and the standard rules are:
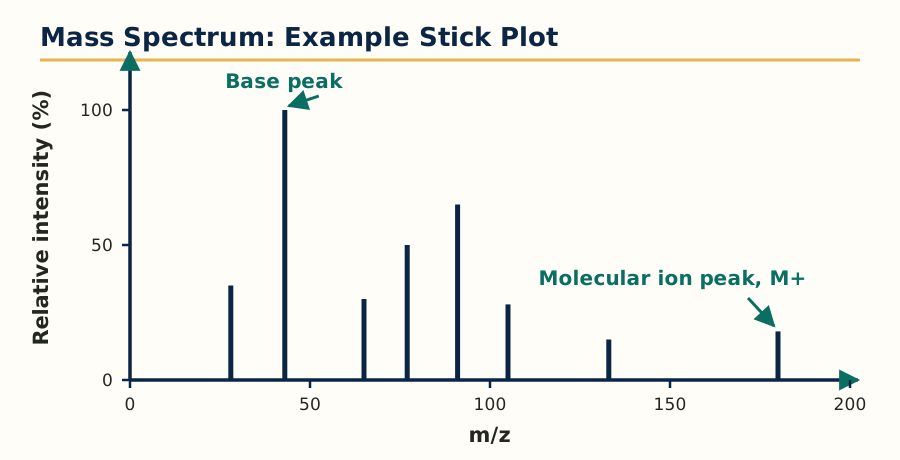 Figure: Example mass spectrum, the tallest stick is the base peak and the highest mass stick shown is the molecular ion peak.
- Cleavage is favoured at branched carbons, because tertiary carbocations are more stable than secondary, which are more stable than primary.
- Bonds next to a heteroatom (alpha cleavage) break readily because the heteroatom lone pair stabilises the resulting cation by resonance, as in alcohols, ethers and amines.
- Allylic and benzylic cleavage is favoured because the cation is resonance stabilised.
- Double bond systems and carbonyl compounds undergo characteristic rearrangements. The most famous is the McLafferty rearrangement: a carbonyl compound with a hydrogen on the gamma carbon transfers that hydrogen through a six membered transition state and cleaves, giving a characteristic enol radical cation peak, classically at m/z 58 for simple ketones and at m/z 60 for methyl esters.
- Loss of stable neutral molecules such as H2O (alcohols), CO (phenols, ketones), CO2 (acids) and small alkenes is common and shows as a peak at M minus that mass.
- Rings and double bonds increase the stability of the molecular ion, so aromatic and cyclic compounds show a strong M+. peak, while long straight chain alcohols may show almost no molecular ion.
3.6 Metastable ions and isotopic peaks
Metastable ions are ions that survive the ion source but fragment during flight, in the field free region. They appear as broad, weak, diffuse peaks at non integral m/z values given by m star = (m2 squared) divided by m1, where m1 is the parent ion mass and m2 is the daughter ion mass. A metastable peak is proof that a particular daughter ion came directly from a particular parent ion in one step.
Isotopic peaks arise because elements occur as isotope mixtures. Chlorine is about 3:1 of mass 35 to 37, so a compound with one chlorine shows M and M+2 peaks in a 3:1 ratio; bromine is about 1:1 of mass 79 to 81, so one bromine gives M and M+2 of nearly equal height; sulphur gives a small M+2 (about 4.4 percent of M); carbon-13 gives an M+1 peak whose height relative to M is about 1.1 percent per carbon atom, which is used to estimate the number of carbons in the molecule. Isotope patterns are the fastest way to detect chlorine or bromine in an unknown drug or impurity.
3.7 Applications of mass spectroscopy
Determination of molecular weight and molecular formula (with high resolution data), structure elucidation from fragmentation, identification of metabolites and impurities at trace level, quantitative bioanalysis by LC-MS/MS and GC-MS (the gold standard for pharmacokinetic studies), confirmation of identity in quality control, isotope ratio work, and proteomics and polymer characterisation by MALDI and ESI. Hyphenated use with chromatography is covered in Unit 4: the chromatograph separates, the mass spectrometer identifies and quantifies each peak.
Unit 4: Chromatography
4.1 Principle and basic terms
Chromatography is a separation technique in which the components of a mixture are distributed between two phases: a stationary phase (a solid, or a liquid coated on a solid, which does not move) and a mobile phase (a liquid or a gas, which flows over the stationary phase). Components separate because they have different affinities for the two phases: the component attracted more strongly to the stationary phase moves slowly, and the component attracted more to the mobile phase moves quickly. The underlying mechanisms are adsorption, partition, ion exchange, size exclusion and affinity, and most examination systems are still classified by which mechanism dominates.
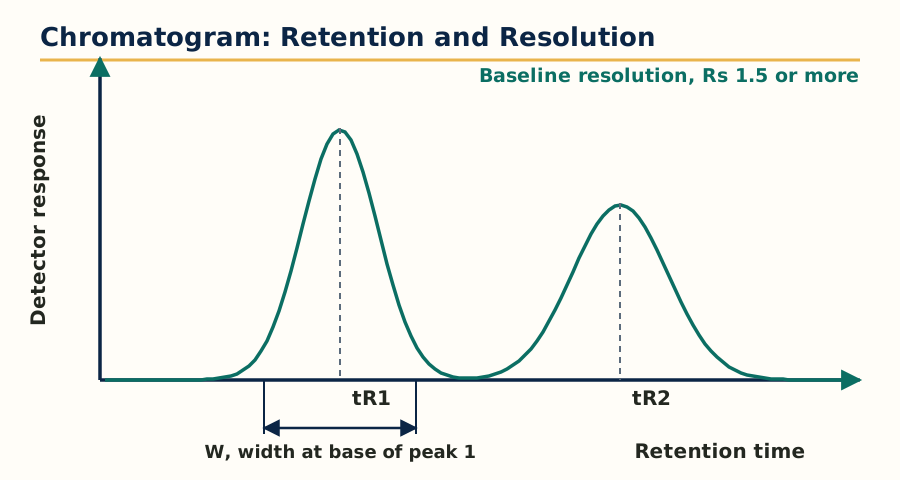 Figure: Chromatogram peaks, retention time, peak width at the base and baseline resolution.
Key chromatographic terms and parameters, used for every technique in this unit:
- Retention time (tR): the time from injection to the peak maximum. The time spent in the mobile phase alone, shown by an unretained marker, is the dead time (tM or t0).
- Retention or capacity factor (k): k = (tR minus tM) divided by tM. It measures how long a compound is held by the stationary phase; good separations usually need k between about 1 and 10.
- Selectivity factor (alpha): the ratio of the k values of two adjacent peaks. It depends on the chemistry of the phases and must be greater than 1 for any separation at all.
- Efficiency and plate number (N): the column behaves as if it contained N theoretical plates; N = 16 x (tR divided by peak width at base) squared, or 5.54 x (tR divided by width at half height) squared. Sharper peaks mean higher N.
- Height equivalent to a theoretical plate (HETP or H): H = column length L divided by N. Smaller H means a more efficient column.
- Resolution (Rs): Rs = 2 x (difference in retention times) divided by (sum of the two peak widths at base). Rs of 1.5 means baseline separation, the target in validated pharmaceutical methods.
- Van Deemter equation: H = A + (B divided by u) + C x u, where u is the mobile phase velocity, A is eddy diffusion (multiple flow paths), B is longitudinal diffusion (important in gases, dominant at low flow), and C is resistance to mass transfer (dominant at high flow). It explains why every column has an optimum flow rate at which H is minimum, and why small, uniform particles improve efficiency by reducing A and C.
Three factors control a separation, one for each term: efficiency improves resolution with the square root of N, selectivity is the most powerful lever, and retention must be kept in a useful range. In practice the analyst changes selectivity first (different stationary phase, solvent, pH or temperature), then efficiency, then retention.
4.2 Paper chromatography
In paper chromatography the stationary phase is water held in the fibres of a cellulose filter paper, and separation is mainly by partition. A spot of sample is applied near one edge, the edge is dipped in the solvent (mobile phase) in a closed chamber saturated with solvent vapour, and the solvent climbs by capillarity. In ascending development the solvent climbs up, in descending development it flows down with gravity assisting, in radial or circular development it spreads outwards from the centre, and in two dimensional development the paper is run in one solvent, dried, turned 90 degrees and run in a second solvent, which greatly increases the number of compounds that can be separated on one sheet. Common paper grades are Whatman No. 1 (routine) and thicker grades for preparative or heavily loaded work.
Results are expressed as the Rf value: distance travelled by the compound divided by distance travelled by the solvent front. Rf depends on the solvent system, temperature and paper, so standards are run on the same sheet. Compounds are detected by colour, by fluorescence or quenching under UV, or by spraying a locating reagent such as ninhydrin for amino acids. Applications today are mainly teaching, simple qualitative checks and some pharmacognostic screening; the method is cheap but slow, poorly reproducible and only semi quantitative.
4.3 Thin layer chromatography (TLC) and HPTLC
In TLC the stationary phase is a thin, uniform layer (about 0.25 mm) of adsorbent, most often silica gel G (silica with gypsum binder), alumina or cellulose, coated on a glass, aluminium or plastic plate. Silica is polar, so separation on normal phase TLC is by adsorption: polar compounds stick and run low, non polar compounds run high. A few microlitres of sample are spotted above the solvent level, the plate is developed in a closed, saturated tank over a short distance (usually 5 to 10 cm), dried, and visualised: coloured spots directly, UV active compounds at 254 nm on plates containing a fluorescent indicator (they appear as dark spots) or at 366 nm for fluorescent compounds, and the rest by spraying reagents or by iodine vapour. Rf is calculated as in paper chromatography, and identity is supported when sample and standard give the same Rf and the same colour reaction in at least two different solvent systems.
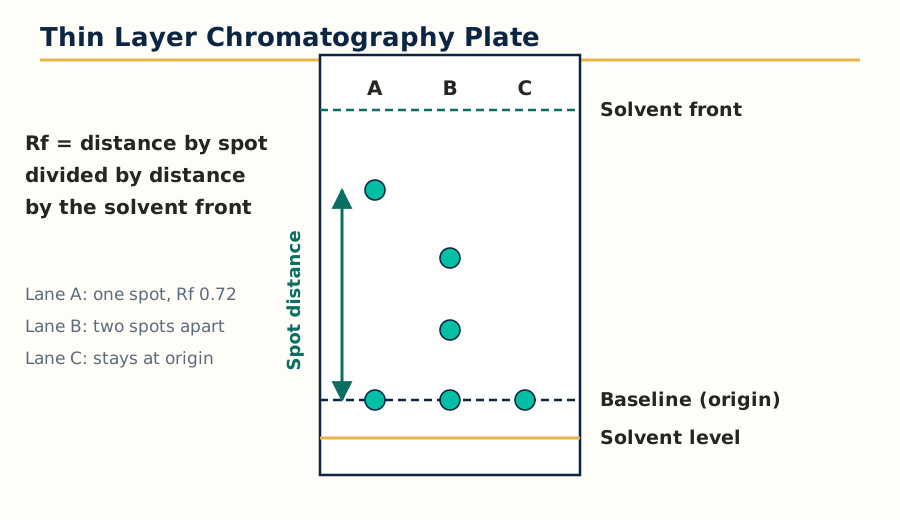 Figure: Developed TLC plate, Rf is the distance travelled by the spot divided by the distance travelled by the solvent front.
TLC remains a pharmacopoeial identity test for many drugs and herbal products because it is fast, cheap, parallel (many samples on one plate) and disposably clean, since the plate is used once and matrix interference is left at the origin. Its limits are moderate reproducibility and mainly qualitative output.
HPTLC (high performance TLC) uses plates with much smaller and more uniform particles (about 5 to 7 micrometres), thinner layers, automatic sample applicators that lay down narrow bands, controlled development chambers and densitometric scanning of the plate. The result is better resolution, lower detection limits and true quantification from spot intensity, used for herbal drug standardisation, fingerprinting of extracts and stability work.
4.4 Ion exchange chromatography
Ion exchange separates charged species on a resin carrying fixed ionic groups. A cation exchanger carries acidic groups (strong type: sulfonic acid, SO3 minus; weak type: carboxylic acid, COO minus) and retains cations. An anion exchanger carries basic groups (strong type: quaternary ammonium; weak type: amino groups) and retains anions. The sample ions compete with mobile phase ions for the resin sites, so elution is controlled by the pH and the ionic strength of the mobile phase: raising salt concentration or changing pH so the analyte loses its charge releases it from the resin.
Resin properties tested in exams: degree of cross linking (higher cross linking, harder resin, slower exchange but better selectivity for ions of different size), exchange capacity (milli equivalents per gram), and particle size. Applications: purification and assay of ionisable drugs and amino acids, removal of interfering ions, water demineralisation (an off line but standard example), separation of rare earths and of charged degradation products, and the amino acid analyser. In modern practice, ion chromatography with suppressed conductivity detection is the routine form for ions such as chloride, sulphate and counter ions in drug salts.
4.5 Column chromatography
Classical column chromatography packs the stationary phase, usually silica gel or alumina of 60 to 200 mesh, into a vertical glass column. The mixture is loaded on top, mobile phase is added, and components travel down at different rates by adsorption, collecting in fractions that are monitored by TLC. Elution can be isocratic (one solvent throughout) or by a polarity gradient in steps. It is a preparative and purification technique rather than an assay technique: isolation of compounds from extracts, purification of synthetic intermediates, and clean up of samples before instrumental analysis. Flash chromatography is its faster modern form, using finer silica and moderate air pressure. The activity of alumina and silica depends on their water content (Brockmann activity grades), so adsorbents are activated by heating and standardised before use.
4.6 Gas chromatography (GC)
GC separates volatile and thermally stable compounds. The mobile phase is an inert carrier gas (helium, nitrogen or hydrogen) and the stationary phase is either a solid adsorbent (gas solid chromatography, for permanent gases) or, far more commonly, a thin film of a high boiling liquid coated inside a long capillary column (gas liquid chromatography). A modern capillary column is 15 to 60 m long, 0.25 mm internal diameter, with a film of a polysiloxane phase; non polar phases separate largely by boiling point, polar phases add selective interactions.
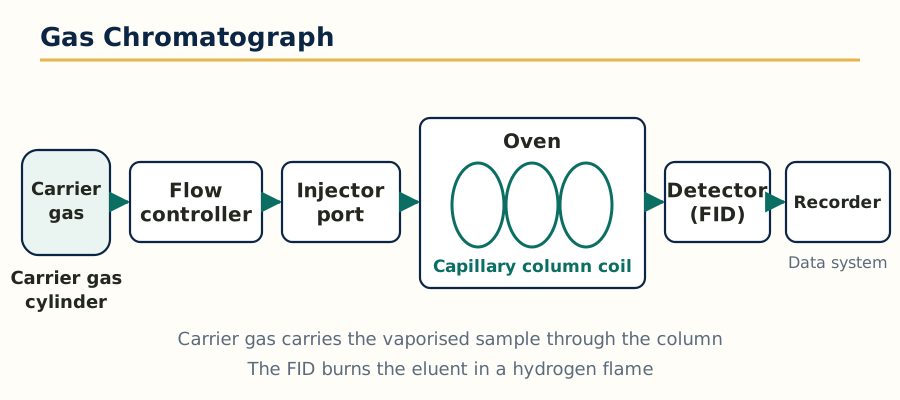 Figure: Gas chromatograph with a capillary column inside a temperature controlled oven.
The GC flow is:
Carrier gas supply and flow controller -> Injector (heated, sample vaporises instantly)
-> Capillary column inside a temperature programmed oven -> Detector -> Data system
- Injector: split injection sends only a small fraction of the sample to the column (for concentrated samples), splitless injection sends nearly all of it (for trace analysis). The injector is kept hot enough to vaporise the sample without decomposing it.
- Oven programme: temperature is raised in a controlled ramp so that both volatile and heavy components elute in reasonable time with good resolution.
- Detectors: the flame ionisation detector (FID) burns the eluent in a hydrogen flame and measures ions formed from carbon compounds; it is sensitive, robust, nearly universal for organics, but destroys the sample and does not respond to water or permanent gases. The thermal conductivity detector (TCD) is universal and non destructive but insensitive, used for gases. The electron capture detector (ECD) is extremely sensitive to halogenated and nitro compounds, used for pesticide and chlorinated drug residues. Other detectors: nitrogen phosphorus detector for N and P compounds, flame photometric detector for S and P, and the mass spectrometer as the most informative detector (GC-MS).
Applications: residual solvents in drug substances (a regulatory must), volatile impurities and essential oil analysis, fatty acid profiling after derivatisation, alcohol content, and analysis of anaesthetic gases. Compounds that are not volatile, such as most drug salts and sugars, need derivatisation, for example silylation, before GC.
4.7 High performance liquid chromatography (HPLC)
HPLC is the most important technique in this whole subject for a working pharmacist, because most drugs are non volatile, polar or heat sensitive, exactly the compounds GC cannot handle. A high pressure pump forces a liquid mobile phase through a short column packed with very fine particles, giving high efficiency in minutes.
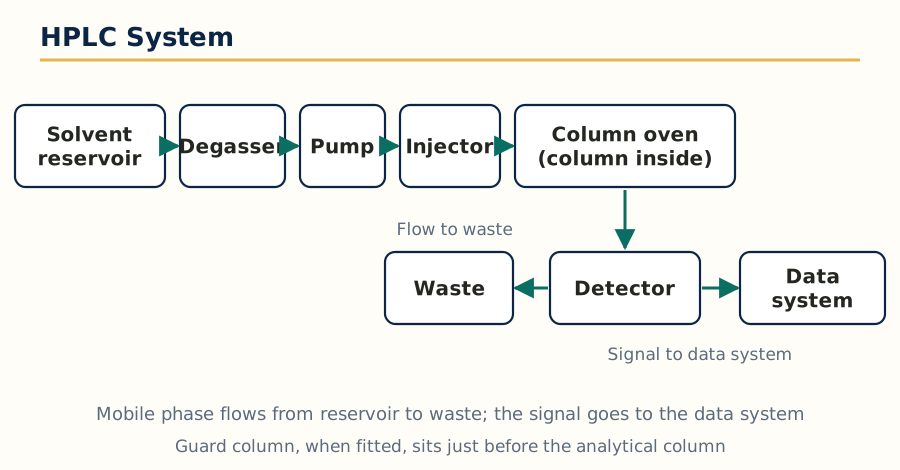 Figure: HPLC system, mobile phase flows from the reservoir through the column and detector to waste.
The HPLC flow is:
Solvent reservoirs (with degasser) -> High pressure pump -> Injector or autosampler
-> Guard column -> Analytical column (in a column oven) -> Detector -> Data system
     (waste out, or fraction collector in preparative HPLC)
- Pumps deliver a pulse free, constant flow, typically 0.1 to 2 mL per minute at pressures up to about 400 bar in conventional HPLC, in either isocratic mode (fixed mobile phase composition) or gradient mode (composition changes during the run to elute strongly retained compounds).
- Columns: stainless steel, commonly 150 or 250 mm long and 4.6 mm internal diameter, packed with 3 to 5 micrometre particles. The workhorse stationary phase is C18 (octadecylsilane bonded silica, reversed phase), followed by C8, phenyl, cyano and amino phases. In reversed phase HPLC the stationary phase is non polar and the mobile phase is polar (water with methanol or acetonitrile, usually buffered); polar compounds elute first. This is the reverse of classical normal phase chromatography, where a polar stationary phase such as bare silica is used with a non polar mobile phase.
- Detectors: the UV and photodiode array (PDA) detector is standard; PDA records the full spectrum of each peak, so peak purity can be checked. Others: refractive index (universal but insensitive and gradient incompatible), fluorescence (very sensitive for fluorescent analytes), electrochemical, evaporative light scattering and charged aerosol detectors for compounds without a chromophore, and the mass spectrometer (LC-MS).
- Method points that decide success: mobile phase pH must control ionisation of the analyte (an ionised drug is barely retained on C18), buffer choice and concentration, organic modifier percentage, column temperature, and system suitability tests (plates, tailing factor, resolution and repeatability) that pharmacopoeias require before results are accepted.
Applications: assay and related substances testing of almost every modern drug product, dissolution and stability studies (stability indicating methods), bioanalysis, cleaning validation and pharmacopoeial monograph methods. In short, if a quality control laboratory could keep only one instrument from this unit, it would keep the HPLC.
4.8 Ultra high performance liquid chromatography (UHPLC)
UHPLC uses columns packed with sub 2 micrometre particles and instruments built for pressures up to about 1000 to 1500 bar. From the Van Deemter equation, smaller particles give lower H and, importantly, keep that efficiency at higher flow rates, so runs become several times faster with equal or better resolution and much lower solvent use. The costs are the need for low dead volume fittings, very clean samples and filtration, and higher instrument cost. Methods transfer from HPLC to UHPLC by scaling column dimensions, flow and gradient time in proportion to column volume and particle size.
4.9 Affinity chromatography and gel chromatography
Affinity chromatography is the most selective of all: the stationary phase carries a ligand that binds one target molecule by a specific biological interaction, for example an antibody binding its antigen, an enzyme binding its inhibitor, or protein A binding the Fc region of antibodies. Everything else washes through; the bound target is then eluted by changing pH, ionic strength or adding a competing ligand. It is used for purification of monoclonal antibodies, enzymes, vaccines and plasma proteins, and for removing specific impurities. It gives purification in a single step that other methods need many steps for, at the cost of expensive and delicate stationary phases.
Gel chromatography, also called size exclusion or gel permeation (for organic solvents) and gel filtration (for aqueous systems), separates purely by molecular size. The stationary phase is a porous gel (dextran, agarose, polyacrylamide or porous silica). Large molecules cannot enter the pores, travel only in the space between particles and elute first; small molecules enter the pores, take a longer path and elute later, so elution order is strictly large to small, the reverse of intuition for students. Nothing is adsorbed ideally, so the mobile phase composition affects elution little. Uses: molecular weight estimation of polymers and proteins, desalting and buffer exchange, separation of aggregates from monomers in biopharmaceuticals, and polymer molecular weight distribution in gel permeation mode.
4.10 Unit 4 comparison table
| Technique | Stationary phase | Separation basis | Typical pharmaceutical use |
|---|---|---|---|
| Paper chromatography | Water held on cellulose paper | Partition | Simple qualitative checks, teaching |
| TLC and HPTLC | Silica gel layer on a plate | Adsorption | Identity tests, herbal fingerprinting, quick screening |
| Ion exchange | Resin with fixed charged groups | Exchange of ions | Ionisable drugs, amino acids, counter ions |
| Column chromatography | Silica or alumina in a glass column | Adsorption | Preparative purification and isolation |
| Gas chromatography | Liquid film in a capillary column | Partition, volatility | Residual solvents, volatile compounds, essential oils |
| HPLC | Bonded phase (C18) packed column | Partition, mainly reversed phase | Assay, impurities, stability, the QC workhorse |
| UHPLC | Sub 2 micrometre packed column | Partition, reversed phase | Fast, high resolution assay and screening |
| Affinity chromatography | Immobilised specific ligand | Biospecific binding | Antibodies, enzymes, vaccines purification |
| Gel chromatography | Porous gel beads | Molecular size | Molecular weight, aggregates, desalting |
Unit 5: Electrophoresis, X-Ray Crystallography, Immunological Assays, Potentiometry and Thermal Techniques
5.1 Electrophoresis: principle
Electrophoresis is the movement of charged particles under the influence of an electric field through a medium. A molecule carrying a net positive charge moves towards the cathode (negative electrode), a molecule with a net negative charge moves towards the anode (positive electrode), and the speed depends on the charge to size ratio: highly charged, small ions move fastest. The mobility of a particle increases with its net charge and the field strength, and decreases with its size and the viscosity of the medium. Because the charge on a drug, amino acid or protein depends on pH relative to its isoelectric point (pI), the buffer pH is the master variable of the whole technique: at pH below pI the molecule is net positive, at pH above pI it is net negative, and exactly at pI its net charge and mobility are zero.
The basic apparatus is the same for most forms: a power supply giving a stabilised direct current, an electrophoresis tank or cell with two buffer reservoirs, electrodes (usually platinum), and the supporting medium that carries the sample. Factors affecting separation are: the net charge and size of the molecule, field strength (higher voltage is faster but generates more heat, which distorts bands), buffer pH, ionic strength (high ionic strength slows migration and sharpens competition for current by buffer ions), temperature, and the nature of the support (adsorption and electro osmotic flow can move even neutral compounds, a useful effect in capillary electrophoresis).
5.2 Types of electrophoresis
- Paper electrophoresis: the sample is applied on filter paper wetted with buffer, held between the two buffer compartments. Simple and cheap, used historically for amino acids, small peptides and serum proteins, with moderate resolution and some diffusion of bands.
- Gel electrophoresis: the run is carried out in a gel slab or rod, usually agarose (for large molecules such as DNA and big proteins) or polyacrylamide (for proteins and smaller fragments, giving molecular sieving because the gel pores sort by size as well as charge). In SDS-PAGE, the detergent sodium dodecyl sulphate coats proteins with a uniform negative charge per unit mass, so separation is by molecular size alone, which gives the molecular weight against standards. Gels are stained after the run (Coomassie blue or silver stain for proteins, ethidium bromide under UV for DNA).
- Capillary electrophoresis (CE): separation happens inside a narrow fused silica capillary (25 to 100 micrometre bore) filled with buffer, at very high voltage. The capillary dissipates heat well, so high fields give very fast, high efficiency separations from nanolitre samples, detected on column usually by UV. Electro osmotic flow sweeps everything towards the cathode, so cations, neutrals and anions can be recorded in one run. Variants include capillary zone electrophoresis, micellar electrokinetic chromatography (which also separates neutral compounds using micelles) and capillary gel electrophoresis. Pharmaceutical uses: chiral separations, purity of peptides and proteins, counter ion and small ion analysis.
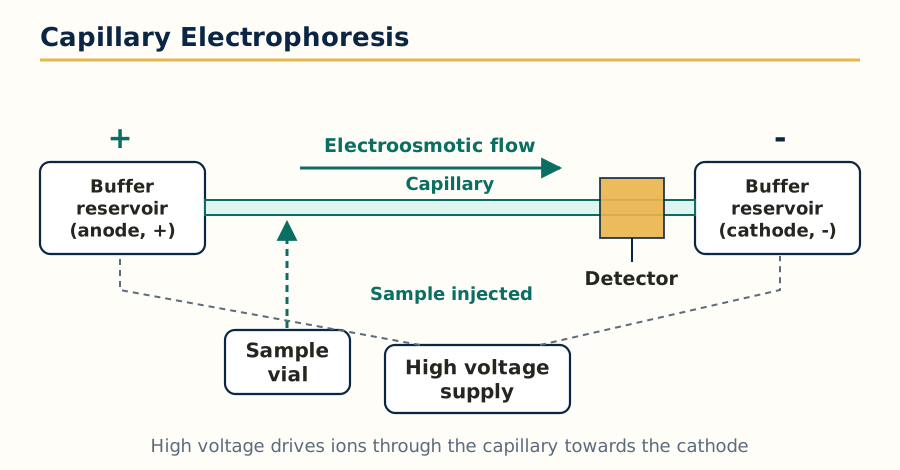 Figure: Capillary electrophoresis set up, electroosmotic flow carries the sample towards the cathode.
- Zone electrophoresis: the general family name for methods in which the sample moves as discrete zones or bands through a stabilising support such as paper, cellulose acetate, starch, agar or polyacrylamide. Cellulose acetate electrophoresis of serum proteins and haemoglobin variants is a standard clinical example.
- Moving boundary electrophoresis: the classical Tiselius method, done in free solution without any support, in a U shaped cell where the boundary between the sample solution and pure buffer moves under the field and is followed optically. It is the historical foundation of the technique; free solution gives true mobilities but convection limits resolution, which is why supported and capillary forms replaced it.
- Isoelectric focusing (IEF): the medium carries a stable pH gradient, created with carrier ampholytes. A protein migrates until it reaches the region where the pH equals its pI, where its net charge becomes zero and it stops, focused into a very sharp band. IEF gives the highest resolution of any electrophoretic form, separates proteins differing by as little as 0.01 pH unit in pI, and is used for charge variant profiling of monoclonal antibodies, haemoglobin variants and as the first dimension of two dimensional gel electrophoresis.
Applications of electrophoresis in pharmacy: purity and molecular weight of proteins and biopharmaceuticals, charge heterogeneity of antibodies, DNA and RNA analysis, haemoglobin and serum protein profiling, chiral drug separation by CE, and identity checks for peptide drugs.
5.3 X-ray crystallography
Production of X-rays: X-rays are produced when a stream of fast electrons from a heated cathode strikes a metal target anode (commonly copper or molybdenum) in an evacuated tube. Most of the energy becomes heat; a small part is emitted as a continuous spectrum (bremsstrahlung) plus sharp characteristic lines of the target metal, such as copper K alpha radiation at wavelength 1.54 angstrom, which is the radiation used for diffraction work. For single crystal work in modern laboratories, rotating anode sources and synchrotron radiation give much higher intensity.
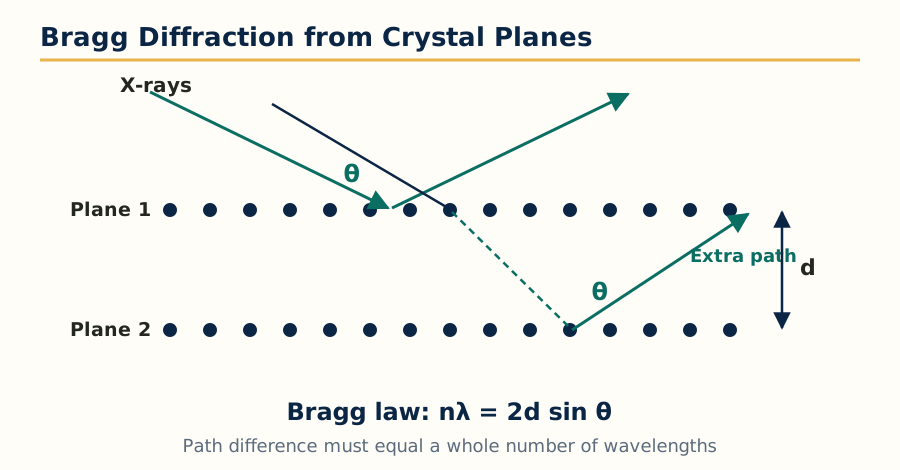 Figure: Bragg diffraction, reflected X-rays reinforce when the path difference equals a whole number of wavelengths.
Bragg law: a crystal acts as a three dimensional diffraction grating for X-rays because the spacing between atomic planes is of the same order as the X-ray wavelength. When X-rays reflect from successive parallel planes of spacing d, the reflected beams reinforce only when the path difference equals a whole number of wavelengths:
n x lambda = 2d sin theta
where n is the order of reflection, lambda is the wavelength, d is the interplanar spacing and theta is the angle of incidence measured from the plane. Bragg law converts the angles at which diffraction is observed into the set of plane spacings of the crystal, the raw data of the structure.
X-ray diffraction methods:
- Rotating crystal technique: a single crystal is rotated about one axis in a monochromatic X-ray beam. Each set of planes satisfies Bragg law at some point of the rotation and produces a spot; the pattern of spots, layer by layer, reveals the unit cell dimensions and symmetry. This is the basis of single crystal structure determination, the definitive method of knowing the exact three dimensional arrangement of atoms in a drug molecule, including absolute configuration and hydrogen bonding.
- X-ray powder technique (powder diffraction, XRPD): the sample is a fine powder of many tiny crystals in all orientations, so instead of spots the diffracted beams form concentric cones and rings. Every crystalline substance gives a unique powder pattern of line positions and intensities, its fingerprint. In pharmacy this is the standard tool for polymorph identification and quantification, checking crystallinity versus amorphous content in formulations, and detecting form changes during stability studies. It needs only milligrams of powder and does not require growing a single crystal.
Types of crystals: crystals are classified into seven crystal systems on the basis of their unit cell geometry: cubic, tetragonal, orthorhombic, hexagonal, trigonal (rhombohedral), monoclinic and triclinic. The unit cell is defined by three edge lengths (a, b, c) and three angles (alpha, beta, gamma); in the cubic system all edges are equal and all angles 90 degrees, while in the triclinic system nothing is equal and no angle is fixed. Fourteen Bravais lattices describe all ways of arranging lattice points in these systems (primitive, body centred, face centred and base centred variants). The same drug can crystallise in more than one arrangement; these are polymorphs, which may differ in solubility, stability and bioavailability, which is why diffraction is a regulatory quality topic and not only a research one.
Applications of X-ray diffraction: absolute structure determination of new drugs and natural products, polymorph screening and control, salt and co crystal characterisation, crystallinity testing of excipients, and identification of crystalline drugs in mixtures and in forensic samples.
5.4 Immunological assays
Immunological assays use the highly specific binding between an antigen and its antibody to measure drugs, hormones, proteins and infectious markers at very low concentrations, in complex samples such as blood, without prior separation.
RIA (radioimmunoassay): the sample antigen competes with a fixed amount of the same antigen labelled with a radioisotope (commonly iodine-125) for a limited number of antibody binding sites. After incubation, bound and free fractions are separated and the radioactivity of one fraction is counted. The more unlabelled antigen in the sample, the less labelled antigen can bind, so the signal falls as concentration rises; a standard curve converts counts into concentration. RIA is extremely sensitive (picogram level) and was the first technique to measure hormones and drugs like digoxin routinely, but it needs radioisotope facilities, shielding, waste disposal and short lived reagents, so it has largely been replaced by non isotopic labels.
ELISA (enzyme linked immunosorbent assay): the label is an enzyme (commonly horseradish peroxidase or alkaline phosphatase) instead of a radioisotope. In the widely used sandwich ELISA, a capture antibody fixed on a plastic well binds the antigen, a second enzyme labelled antibody binds another site of the same antigen, unbound material is washed away, and a substrate is added that the enzyme converts into a coloured product measured in a plate reader. In competitive ELISA, sample antigen competes with labelled antigen, and colour falls as concentration rises. ELISA keeps most of the sensitivity of RIA, is safe, has long reagent shelf life, and is easily automated in 96 well plates; uses include therapeutic drug monitoring, infectious disease markers, vaccine potency work and residue testing.
Bioluminescence assays: these use a naturally light producing enzyme system, most often firefly luciferase, which in presence of luciferin, ATP, oxygen and magnesium produces light. The light output is proportional to the limiting component, usually ATP, so the assay measures ATP as an index of living microbial cells: it is used for rapid microbial contamination and sterility related screening, hygiene monitoring of manufacturing surfaces and water, and cell viability testing. Related chemiluminescence immunoassays, using labels such as acridinium esters, are now common in automated clinical analysers because light based detection has almost no background and a very wide measurement range.
| Feature | RIA | ELISA | Bioluminescence (ATP) assay |
|---|---|---|---|
| Label or signal | Radioisotope such as iodine-125 | Enzyme producing a coloured product | Light from the luciferase reaction |
| Signal direction in competitive format | Falls as analyte rises | Falls as analyte rises | Rises with the amount of ATP present |
| Safety and waste | Radiation hazards, special disposal | Safe, routine laboratory waste | Safe, routine laboratory waste |
| Typical use | Hormones, digoxin, research assays | Drug and marker assays, screening in plates | Microbial load, hygiene and cell viability |
5.5 Potentiometry
Potentiometry measures the potential (voltage) of an electrochemical cell at effectively zero current, and relates it to the concentration of a specific ion through the Nernst equation: E = E0 plus (RT divided by nF) times the natural log of the ion activity, which at 25 degrees Celsius becomes a change of about 59.16 mV for every ten fold change in activity of a singly charged ion. The cell has two electrodes: an indicator electrode whose potential responds to the analyte, and a reference electrode (saturated calomel or silver silver chloride) whose potential is constant.
Ion selective electrodes (ISE) are indicator electrodes whose membrane responds mainly to one ion: the glass electrode for pH and H+, the fluoride electrode with a lanthanum fluoride crystal membrane, crystalline and liquid membrane electrodes for ions such as calcium, nitrate, potassium and chloride, and gas sensing electrodes for ammonia and carbon dioxide. A practical assembly combines both electrodes in one combination probe with a meter reading in mV or directly in pH or concentration units; calibration with at least two standards bracketing the sample is essential, and an ionic strength adjuster keeps activity coefficients constant. Applications: pH measurement and potentiometric titrations (acid base, redox, precipitation and complexometric, where the end point is the steepest jump in potential), direct assay of fluoride and other ions in formulations and water, and monitoring of dissolution media. Its strengths are simplicity, low cost and no need for separation; its limits are interference from similar ions and the need for frequent calibration.
5.6 Thermal techniques: DSC, DTA and TGA
Thermal analysis studies how a sample changes when it is heated or cooled at a controlled rate. In pharmacy it answers questions no spectrum can: at what temperature the drug melts, whether it is polymorphic, whether it is crystalline or amorphous, whether drug and excipient interact, and how much solvent or moisture it holds.
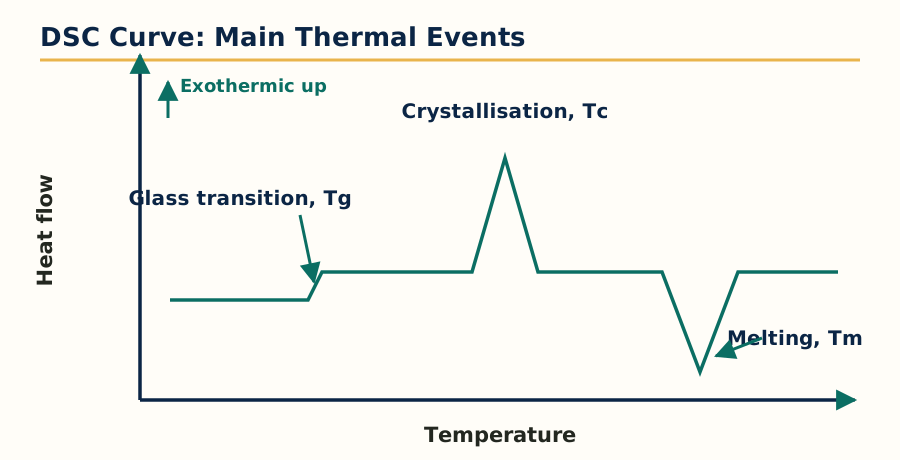 Figure: DSC curve with glass transition, crystallisation and melting events, exothermic direction up.
Differential scanning calorimetry (DSC): the sample and an inert reference are heated in separate pans, and the instrument measures the difference in heat flow needed to keep both at the same temperature as the furnace temperature rises at a linear rate. In the power compensation design two independent heaters supply that heat directly; in the heat flux design both pans sit on one heated disc and the temperature difference between them is converted into heat flow. The DSC curve plots heat flow against temperature: melting and other endothermic events appear as peaks in one direction, crystallisation and decomposition (exothermic events) in the other, and a glass transition appears as a step change in the baseline, the signature of an amorphous material. Two refinements from the syllabus: modulated DSC superimposes a small sinusoidal temperature oscillation on the ramp, which separates overlapping reversing events such as glass transition from non reversing events such as enthalpy relaxation and curing; hyper DSC uses very fast heating rates (hundreds of degrees per minute) to increase sensitivity for tiny samples and weak transitions and to suppress reorganisation during the scan.
Experimental parameters that influence a DSC result, and which must be reported with it: sample preparation and mass (usually 2 to 10 mg, sealed, pin holed or open pan as the study needs), heating and cooling rate (faster rates raise observed transition temperatures and reduce resolution of close events, slower rates do the opposite), purge gas and its flow (nitrogen is standard; oxygen is used for oxidation studies), calibration with standards such as indium (melting point and heat of fusion) for temperature and enthalpy, and the thermal history of the sample itself, which is why a first heating run and a second heating run of the same sample can differ. Sources of error include poor pan contact, moisture loss mistaken for a transition, decomposition overlapping melting, and baseline drift.
Differential thermal analysis (DTA): the older and simpler relative of DSC. Sample and reference sit in the same furnace and the temperature difference between them (delta T) is plotted against furnace temperature. When the sample melts it absorbs heat and lags behind the reference; when it crystallises or oxidises it gets ahead. DTA gives transition temperatures and a qualitative picture up to very high temperatures, but it does not measure energy as directly or as accurately as DSC. Derivative DTA (DDTA) plots the derivative of the DTA curve, which sharpens overlapping events and locates transition points more precisely.
Thermogravimetric analysis (TGA): a sensitive microbalance weighs the sample continuously while it is heated in a controlled atmosphere. The TGA curve plots mass (or percentage mass) against temperature, and its derivative (DTG) marks the temperatures of fastest mass loss. Mass falls in steps when volatile components leave: surface moisture first, then solvent of crystallisation, then decomposition products. Factors affecting TGA results: heating rate, atmosphere (air gives oxidative loss, nitrogen gives pyrolysis), sample mass and particle size, crucible type, and buoyancy effects at the start of the run. It measures only events that change mass, so melting without decomposition is invisible to TGA, which is exactly why DSC and TGA are run together as complementary methods.
| Feature | DSC | DTA | TGA |
|---|---|---|---|
| Quantity measured | Difference in heat flow | Difference in temperature | Change in mass |
| Melting point | Yes, with enthalpy of fusion | Yes, temperature only | No, unless mass is lost |
| Glass transition | Yes, clear step | Weak or unclear | No |
| Moisture and solvent content | Indirect | Indirect | Yes, directly from mass loss steps |
| Polymorphism study | Yes | Yes | No |
| Main pharmaceutical uses | Melting, purity, polymorphism, compatibility, amorphous content | High temperature transitions, qualitative thermal profile | Drying loss, solvates and hydrates, decomposition, ash related work |
Pharmaceutical applications of thermal methods, combined: drug excipient compatibility screening from changes in the drug melting peak, polymorph identification (different forms melt differently), determination of purity from melting point depression (the Van't Hoff DSC purity method), amorphous content measurement, stability prediction, characterisation of lipids, waxes and polymers used in formulations, and confirmation of hydrate and solvate stoichiometry by matching TGA mass loss with theory. Advantages: tiny samples, speed, and information about physical form that chemical assays miss. Disadvantages: destructive for the portion tested, results depend strongly on experimental conditions, and overlapping events can be hard to assign without a supporting method such as hot stage microscopy or XRPD from Section 5.3.
Frequently Asked Questions
Q: Write the Beer-Lambert law and list any four reasons for deviation from it. The law states A = epsilon x b x c, where absorbance is directly proportional to molar absorptivity, path length and concentration. Deviations occur when the radiation is not monochromatic, when stray light reaches the detector, when the solution is too concentrated so molecules interact with each other, and when the solute associates, dissociates or reacts with the solvent or changes form with pH.
Q: What are the advantages of FT-IR over a dispersive IR spectrophotometer? FT-IR measures all frequencies at once through an interferometer (Fellgett or multiplex advantage), passes more radiation to the detector because it has no narrow slits (Jacquinot or throughput advantage), and uses a laser reference for a highly accurate wavenumber scale (Connes advantage). The result is a spectrum in seconds with a much better signal to noise ratio.
Q: What is chemical shift? Why is TMS used as the reference in NMR? Chemical shift is the position of an NMR signal on the delta scale in ppm, measured relative to TMS, and it tells the electronic environment of the protons. TMS is used because its 12 protons are equivalent and give one sharp strong signal, it is chemically inert and volatile so it can be removed easily, and its signal appears upfield of almost all sample signals.
Q: A proton NMR signal is a quartet and another is a triplet, with the same J value. What does this tell you? The two groups are coupled to each other. By the n+1 rule, the quartet has three equivalent neighbouring protons and the triplet has two, the classic picture of an ethyl group, CH3 giving the triplet and CH2 giving the quartet. Equal J values confirm they are mutual coupling partners.
Q: Compare EI and ESI ionisation in mass spectroscopy. Electron impact is a hard ionisation using 70 eV electrons on vaporised samples; it fragments the molecule heavily, which is useful for structure work but the molecular ion may be weak or absent, and the sample must be volatile. Electrospray is a soft ionisation from liquid solution at atmospheric pressure; it gives strong molecular species, often multiply charged, with little fragmentation, and it suits polar, large and heat sensitive molecules in LC-MS.
Q: How does the presence of chlorine or bromine show up in a mass spectrum? Chlorine occurs as mass 35 and 37 in about a 3:1 ratio, so a compound with one chlorine shows M and M+2 peaks in that ratio. Bromine occurs as mass 79 and 81 in about a 1:1 ratio, so one bromine gives M and M+2 peaks of almost equal height. These isotope patterns are the quickest way to spot a halogen in an unknown compound.
Q: Define resolution, plate number and HETP. What resolution value means baseline separation? Plate number N measures column efficiency, N = 16 (tR/W) squared. HETP is the column length divided by N, and a smaller HETP means a better column. Resolution Rs compares the separation of two peak maxima with their widths, and Rs of 1.5 or more means the two peaks are separated to the baseline, the standard target in pharmaceutical methods.
Q: Why is reversed phase HPLC used more than normal phase HPLC in quality control? In reversed phase HPLC a non polar C18 stationary phase is used with a water based polar mobile phase, which suits most drugs, gives reproducible retention, is compatible with aqueous samples and dissolution media, and the columns are robust and long lived. Normal phase with bare silica is very sensitive to traces of water in the mobile phase, which makes retention drift, so it is reserved for special cases.
Q: State Bragg law and give two pharmaceutical applications of X-ray diffraction. Bragg law states n lambda = 2d sin theta, relating the wavelength, the spacing d between crystal planes and the angle theta at which diffraction occurs. Its main pharmaceutical uses are identification and quantification of polymorphs by powder diffraction, and complete three dimensional structure determination of drug molecules by single crystal diffraction.
Q: What is isoelectric focusing? Isoelectric focusing is electrophoresis in a stable pH gradient. A protein migrates until it reaches the pH equal to its isoelectric point, where its net charge becomes zero and it stops, focused into a sharp band. It separates proteins with very small differences in isoelectric point and is used for charge variant profiling of proteins and monoclonal antibodies.
Complete MPH101T notes, all 5 units in one PDF, free to keep.
Other M.Pharm subjects: MPH101T · MPC101T · MPL101T · MPH102T · MPH103T · MPH104T · M.Pharm