
← Human Anatomy and Physiology Practicals
Recording and interpretation of a simple muscle fatigue curve
1. Aim
To follow the change in response height during a series of comparable stimuli in an approved sciatic-gastrocnemius simulation or instructor-supplied trace and identify a fatigue pattern. [1, 2]
2. Requirements
An instructor-approved simulation or archived recording that shows the response axis, time or trial axis, and stimulus marks; a ruler or measurement cursor; and an observation sheet. A demonstration may include a stimulator, electrodes, transducer or lever, and recorder. The preparation source, stimulus pattern, load or resting tension, calibration, and any authorization for biological material are specified in your college lab manual and instructor's method sheet. Students do not prepare tissue or animals from this article. [2, 3]
3. Theory
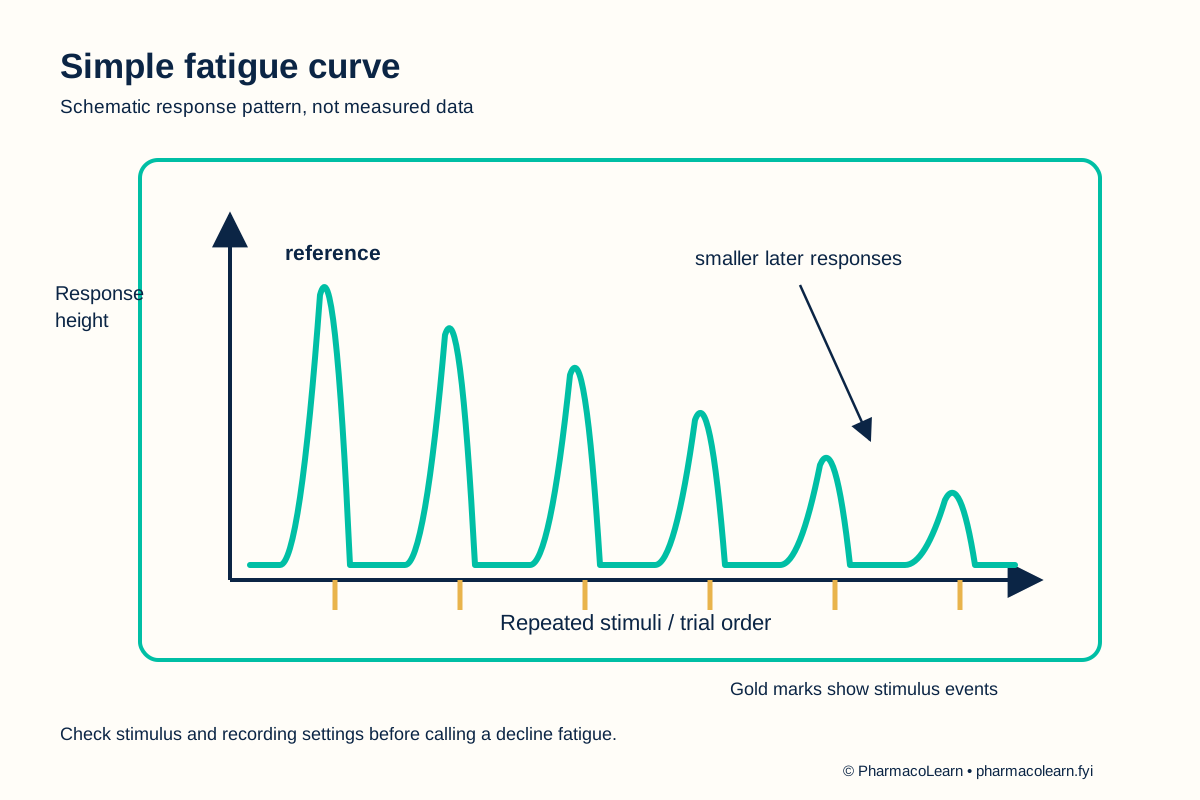
In this practical, a fatigue curve is a series of muscle responses whose size declines during repeated comparable stimulation. The starting response provides a within-record reference. A later response should be compared only when stimulus strength, recording gain, load, and baseline convention have remained comparable. A resting interval may be followed by partial or full recovery, but the actual pattern depends on the preparation and conditions. [2]
A falling trace by itself does not identify where performance declined. The nerve, neuromuscular junction, muscle fibers, recording setup, or their combined behavior may affect the record. Check the stimulus marks and recording stability before interpreting a smaller response as biological fatigue. This is a teaching-lab curve, not a clinical muscle-function test. [2]
4. Procedure
- Obtain an approved simulation or instructor-supplied recording with repeated stimuli. Any use of biological material requires separate institutional authorization, trained personnel, and an applicable welfare procedure. The local authorization and source are specified in your college lab manual and instructor's method sheet. [3]
- Identify the stimulus marks, baseline, response direction, time or trial axis, and response-axis units. Record the recording calibration and units here. [2]
- Check whether the stimulus amplitude and interval, load, and recorder settings are labeled as constant. Record their labelled values and whether the settings remain constant here. If they change, note this before comparing response heights. [2]
- Select the first clearly measurable response as the reference. Mark its baseline and peak. If the first response is an artifact or cannot be measured, choose and document another reference; the chosen reference must be recorded here. [2]
- Measure the peak response at several later labeled trials or time points with the same baseline convention. Record any progressively smaller responses, missing responses, or altered baseline without smoothing the trace. [2]
- If an instructor-supplied record includes a rest period, mark its start and the first response afterward. Do not assume recovery if the record has no post-rest response. [2]
- Enter the observations, plot response height against trial or time if the axes are calibrated, and describe whether the record supports fatigue. Submit the annotated trace in the local format, which is specified in your college lab manual and instructor's method sheet. [2]
5. Calculation, graph, or images as appropriate
Record actual measurements here. The rows do not prescribe a number of stimuli or a normal response. [2]
| Point on record | Trial or time and unit | Peak above its baseline and unit | Stimulus and load comparable? | Comment |
|---|---|---|---|---|
| Chosen reference | Record here | Record here | Record here | Record here |
| Later response | Record here | Record here | Record here | Record here |
| Last measured response | Record here | Record here | Record here | Record here |
| After rest, if present | Record here | Record here | Record here | Record here |
Calculation: Percentage of reference response = (later peak height ÷ reference peak height) × 100, using the same units and baseline convention. For a symbolic worked example, if the reference height is H and the later height is h, the reported fraction is h/H and the percentage is (h/H) × 100. The measured H, h, and percentage must be recorded here. Do not calculate a percentage when the reference is zero, the scales differ, or the trace is uncalibrated. [2]
6. Result
The trace source, first and last measured responses, their percentage comparison, and any post-rest response must be recorded here. State whether repeated comparable stimuli produced a declining response and list any recording limits. A curve alone does not establish the site or biochemical cause of fatigue. [2]
7. References
- Pharmacy Council of India. Pharm.D. Regulations, 2008, Appendix A. Lists the simple fatigue curve using a gastrocnemius sciatic-nerve preparation.
- William Paterson University. Animal Physiology Lab Manual, Lab 6: Frog Leg Muscle Contraction. Describes repeated stimulation, declining response, and possible sites of fatigue.
- Committee for Control and Supervision of Experiments on Animals. Acts, Rules and Guidelines. Institutional animal-use oversight.
Back to Human Anatomy and Physiology Practicals · All Pharm D Practicals · Pharm D
Theory notes: Human Anatomy and Physiology