
Dose Response Curve of Acetylcholine Using Isolated Ileum or Rectus Abdominis
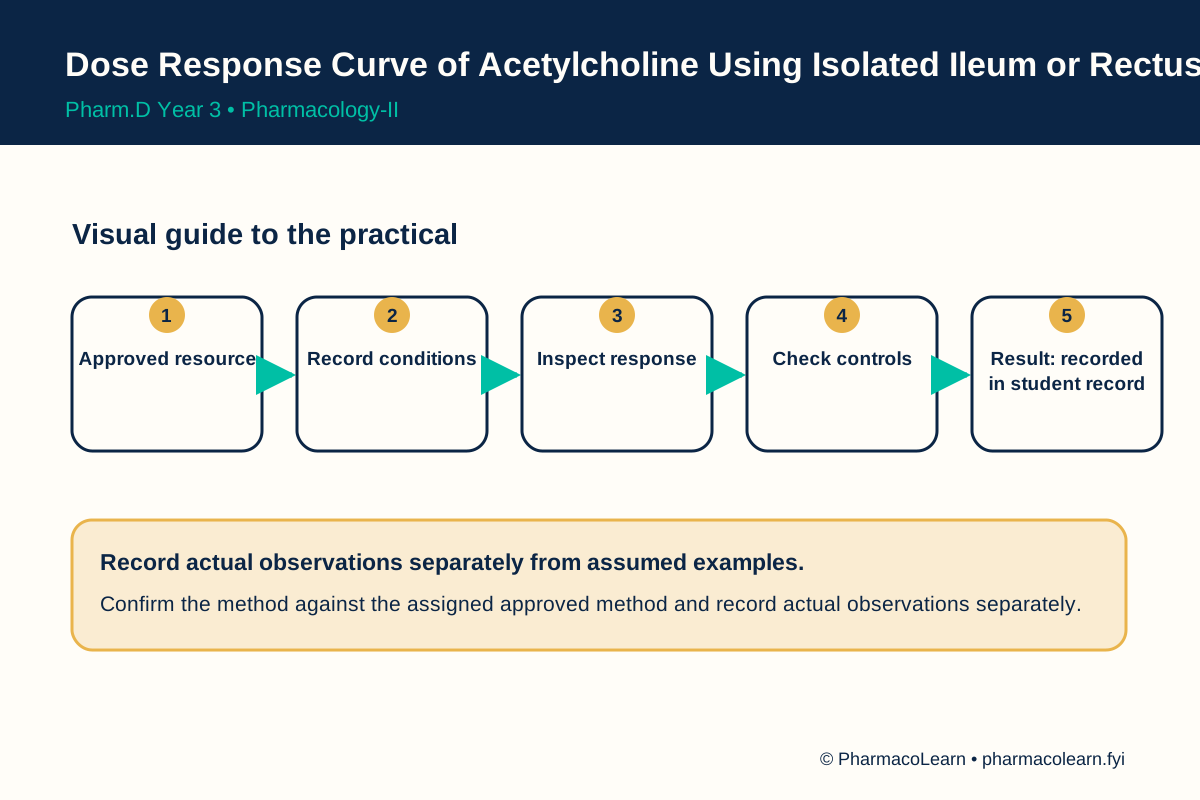
1. Aim
To study dose response curve of acetylcholine using isolated ileum or rectus abdominis using an instructor-approved demonstration, diagram, or existing dataset, and document the supported interpretation. The approved model and actual outcome must be entered in the student record.
2. Requirements
Instructor-approved acetylcholine concentration and isolated-tissue response records, relevant method sheet, labelled observation or response record, graph paper or spreadsheet when needed, ethical approval and facility documentation where animal material is involved, and a supervisor. Exact species or tissue source, concentrations, dosing, bath composition, temperature, timing, and equipment settings are specified in your college lab manual and instructor's method sheet.
3. Theory
Concentration-response relationship and maximal effect is the central idea of this syllabus entry. Experimental pharmacology links a controlled input with a measured biological response. A valid interpretation depends on the preparation, controls, stable baseline, calibration, and documented method. The student should separate raw observations from inference and should not equate a teaching trace with clinical efficacy. Replacement, reduction, and refinement guide animal-related teaching. This article uses existing approved records or simulation as its student-facing route; any physical animal or isolated-tissue work requires institutional authorization and trained staff.
4. Procedure
- Confirm the exact syllabus entry, institutional approval status, and instructor-selected teaching resource.
- Record the source, species or tissue if relevant, apparatus or dataset identifiers, and controls. Missing information is specified in your college lab manual and instructor's method sheet.
- Plot the supplied response against log concentration. Identify baseline, monotonic region, maximum, and any outlier before estimating EC50 from valid data.
- Write raw observations before naming an effect, and compare them with the relevant controls or standard.
- Calculate or graph only when units, inputs, and method validity are documented; flag unsupported results Record here.
- State the conclusion, its uncertainty, and whether the exercise used a demonstration, recording, simulation, or approved physical preparation.
5. Observation and calculation
| Student record field | Entry |
|---|---|
| Case or product | Record here |
| Method | Record here |
| Observation | Record here |
| Inference | Record here |
| Supervisor check | Record here |
| Outcome | Record here |
Assumed values or observations for practice only: Assumed responses of 10, 30, 60, and 80 arbitrary units at four assumed ordered concentrations illustrate a rising curve. All values are invented; EC50 must be entered in the student record without actual concentration labels. Every invented input and output is assumed; it is not an animal procedure, dose instruction, or actual laboratory result.
6. Output or final result
Submit a labelled dose response curve with controls, observations, and a conditional interpretation. Record the supervised outcome here.
Teaching-lab safety: Teaching-lab supervision and institutional animal ethics approval are required for any live-animal or isolated-tissue work. Students should use approved recordings or simulations unless explicitly trained and authorized. No drug dose or animal procedure is specified here.
This page is a supervised-activity guide; it does not report a completed case.
7. Sources
- PharmacoLearn Pharm.D Year 3 syllabus
- PCI Pharm.D Regulations and Syllabus
- CCSEA Acts, Rules and Guidelines
- NC3Rs, The 3Rs
- IUPHAR Pharmacodynamics
Back to Pharmacology-II Practicals · All Pharm D Practicals · Pharm D
Theory notes: Pharmacology II