
← Pharmaceutical Analysis Practicals
Comparison of UV Spectrum of a Compound with Its Derivatives
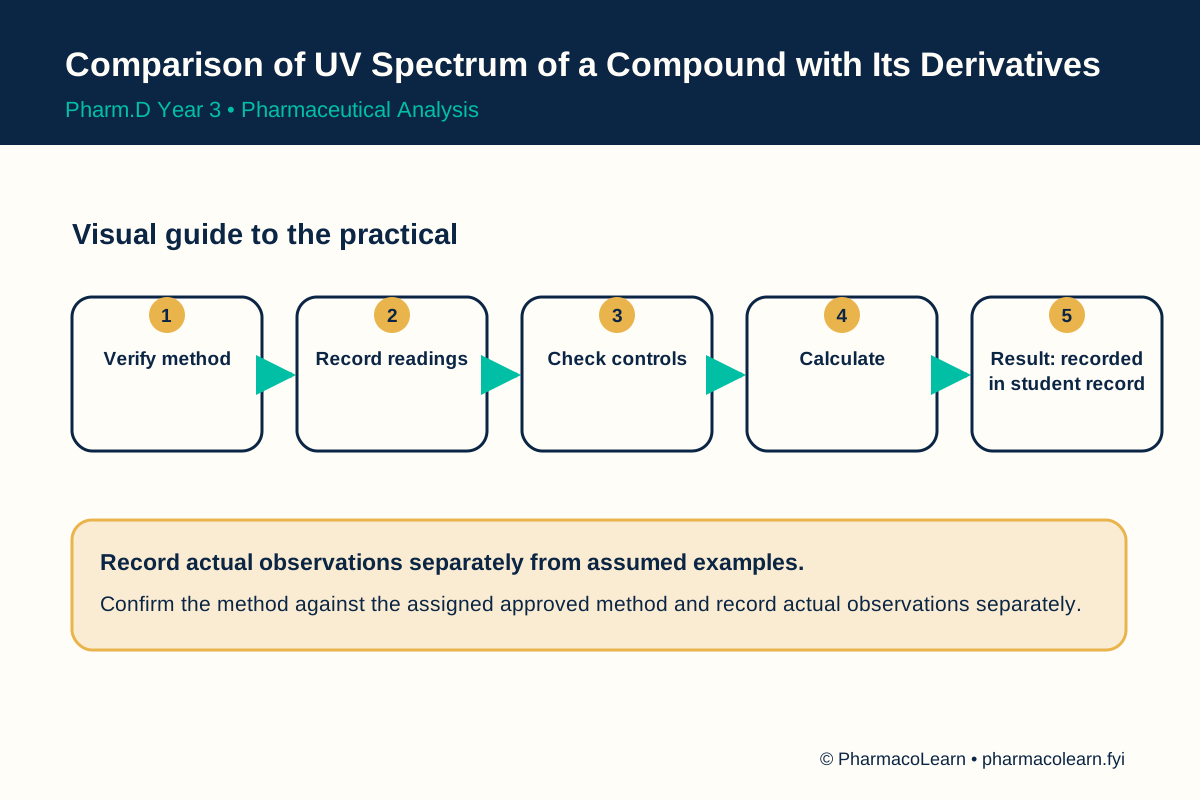
1. Aim
To complete the Year 3 syllabus practical comparison of uv spectrum of a compound with its derivatives using an instructor-approved method or dataset. Actual analyte, measurements, and result must be entered in the student record.
2. Requirements
Instructor-approved sample and reference standard, validated method, instrument and calibration records, blank and controls, observation sheet, calculator or graphing aid, protective equipment, and chemical waste route. Confirm sample identity from its label and use the college method sheet for reagent quantities, concentrations, wavelengths, pH, and temperature. Acceptance criteria are to be recorded from the assigned current monograph or approved college method in the student record.
3. Theory
A structural derivative can alter chromophores and thus its ultraviolet-visible spectrum. Similar or different peaks support a comparison but do not independently prove molecular identity. Record instrument settings, blanks, solvent, concentration, and path length before comparing maxima or intensity.
4. Procedure
- Confirm sample identity, method version, hazards, instrument calibration, and required controls.
- Record raw standards, blanks, sample readings, units, and any preparation or dilution factors.
- Follow the verified laboratory method under instructor supervision, or analyze its supplied dataset.
- Align the supplied parent and derivative spectra on the same wavelength scale. Identify peak positions, shoulders, and intensity changes, then check each against its reference record.
- Check the fit, control recovery, and measurement range before applying a formula.
- Report the calculation with units, method limitations, and unresolved details recorded in the student record.
5. Observation and calculation
| Student record field | Entry |
|---|---|
| Case or product | Record here |
| Method | Record here |
| Observation | Record here |
| Inference | Record here |
| Supervisor check | Record here |
| Outcome | Record here |
Assumed values for calculation practice only: An assumed parent peak is 250 nm and an assumed derivative peak is 260 nm. The assumed difference is 10 nm. These invented values are a comparison example, not an identification. Each invented input and output is assumed, not a reagent instruction or actual laboratory result.
6. Output or final result
Submit a labelled parent and derivative spectra, calculations where justified, and a conditional conclusion. Record the supervised outcome here.
Teaching-lab safety: Use instructor-supervised chemical handling and the approved disposal method. No assumed value here authorizes a preparation or analytical release decision.
This page is a supervised-activity guide; it does not report a completed case.
7. Sources
- PharmacoLearn Pharm.D Year 3 syllabus
- PCI Pharm.D Regulations and Syllabus
- USP <857> Ultraviolet-Visible Spectroscopy
- USP <1226> Verification of Compendial Procedures
Back to Pharmaceutical Analysis Practicals · All Pharm D Practicals · Pharm D
Theory notes: Pharmaceutical Analysis